BNB (BNB/USDT) Builds Support While Buyers Push Toward Resistance
Estimated Reading Time: 3 minutes
Don’t invest unless you’re prepared to lose all the money you invest. This is a high-risk investment and you are unlikely to be protected if something goes wrong. Take 2 minutes to learn more
BNBUSDT Long-term Analysis: Bullish
The market sentiment for BNB against the Tether is currently neutral to bullish. However, over the past few months, the pair has been trading within a tight range, showing signs of consolidation. This period of sideways movement comes after a strong rally and correction, suggesting that the market is stabilizing.
Recently, the candle formation indicates a potential buildup of buying pressure near the support area. The price sitting above key moving averages, while the Stochastic RSI is pushing signals of a tendency of an upward breakout if the momentum continues.
Currently, BNB trades at $662.78, recording over 21K traded volumes at the beginning of the week.
Technical Indicators
Major Resistance Levels: $690, $725, and $790
Major Support Levels: $620, $590, and $565
BNB Technical Analysis
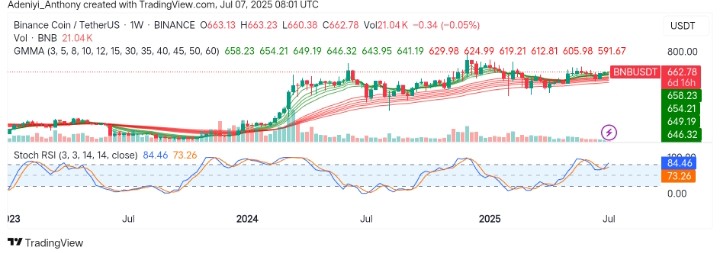
The analysis of BNB against the Tether on the weekly timeframe shows that the pair is preparing for a northbound movement after a short period of consolidation. However, the Guppy Multiple Moving Averages (GMMA) are tightly compressed, suggesting a period of low volatility and consolidation.
Beneath the chart, the Stochastic RSI is in the overbought zone (84.46), showing momentum with the bulls, with the possibility of a short-term pullback as volume remains steady.
To this end, the pair may continue building on a bullish structure if a close above $675 is built; otherwise, a pullback is possible with a close below the current level.
BNB/USDT Analysis: Can the Bulls Sustain the Momentum?
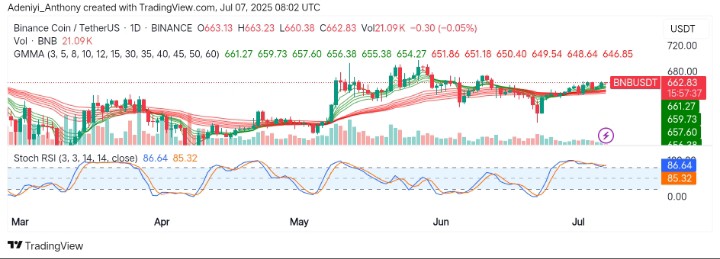
On the daily timeframe, BNB/USDT is consolidating near the top of its recent range, below $665. However, the GMMA ribbons are fanning upward with price trading above most EMAs, showing growing bullish strength.
From another angle, the Stochastic RSI is in the overbought zone (86.64) but still pointing upward, suggesting strong buyer momentum as the volume indicator points to increasing participation.
To this end, a daily close above $668–$670 would likely trigger more buying strength towards $700, while a move below $651 would invalidate the move.
You can purchase crypto coins here. Buy LBlock