XRP Bounces But May Face Rejection at the $0.55 Barrier
Estimated Reading Time: 2 minutes
Don’t invest unless you’re prepared to lose all the money you invest. This is a high-risk investment and you are unlikely to be protected if something goes wrong. Take 2 minutes to learn more

XRP (XRP) Long-Term Analysis: Bearish
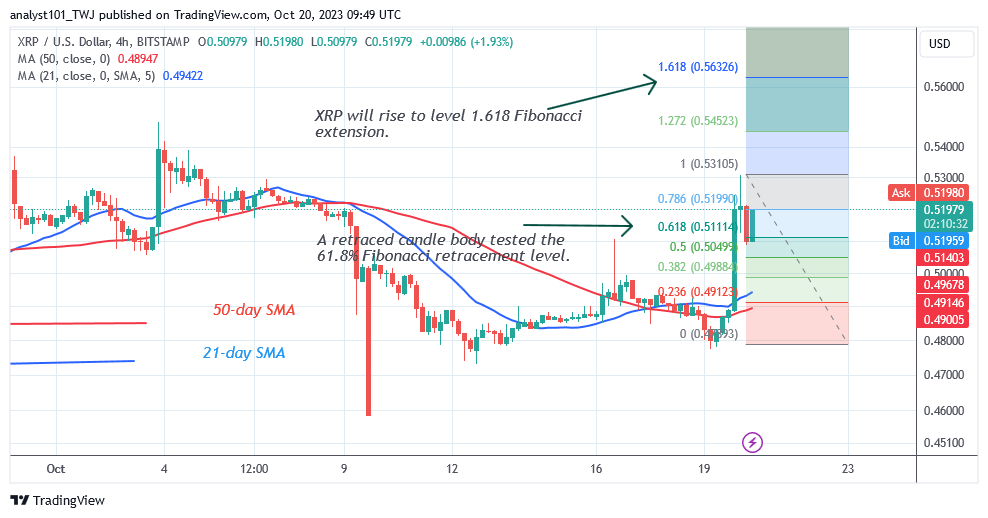
XRP’s (XRP) price has recovered and broken above the moving average lines but may face rejection at the $0.55 barrier. The upward trend is predicted to last to $0.56, but it has already peaked. The cryptocurrency has retraced and is now trading above the moving average lines. If the altcoin remains above the moving average lines, it will increase.
The price indicator predicts that XRP/USD will rise to a high of $0.56. This bullish scenario, however, is likely to be rejected at the $0.55 overhead resistance. On the bright side, if buyers succeed, XRP will reach a high of $0.66. The current horizontal trend will resume if XRP is denied at the aforementioned barrier level.
Technical Indicators:
Major Resistance Levels – $1.00, $1.50, $2.00
Major Support Levels – $0.50, $0.30, $0.10
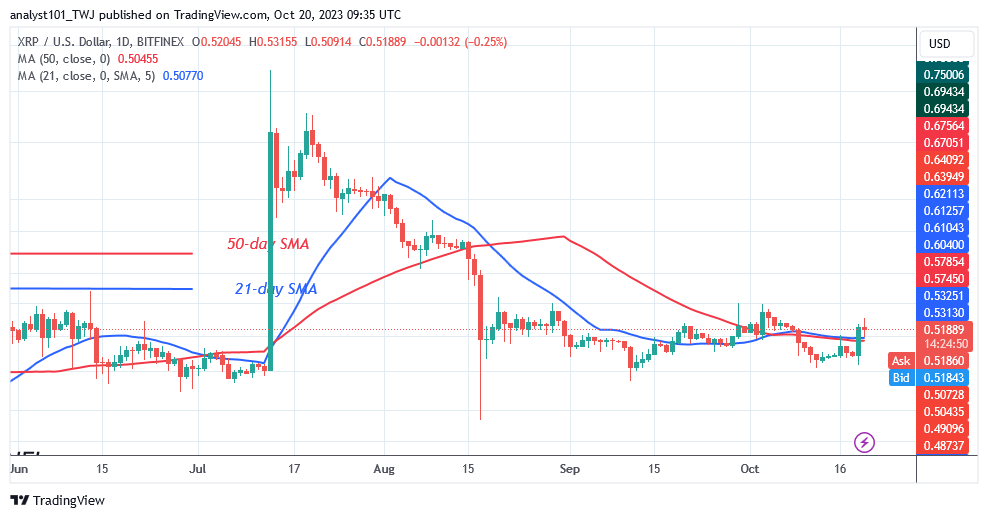
XRP (XRP) Indicator Analysis
The price bars are above the moving average lines as the altcoin finds support above the lines. A bullish crossing occurred when the 21-day SMA of XRP surpassed the 50-day SMA. Trading can resume placing purchase orders as a result. However, the moving average lines are horizontal despite the positive improvements.
What Is the Next Direction for XRP (XRP)?
The altcoin has reached a high of $0.53 but may face rejection at the $0.55 barrier. XRP is now bouncing between the moving average lines and the overhead resistance. The altcoin is expected to increase and retest the barrier level of $0.55. As of this writing, the $0.55 resistance level has not been overcome.
You can purchase crypto coins here. Buy LBLOCK
Note: Cryptosignals.org is not a financial advisor. Do your research before investing your funds in any financial asset or presented product or event. We are not responsible for your investing results

