XRP Commences Its Range as It Holds above $0.47
Estimated Reading Time: 2 minutes
Don’t invest unless you’re prepared to lose all the money you invest. This is a high-risk investment and you are unlikely to be protected if something goes wrong. Take 2 minutes to learn more
XRP (XRP) Long-Term Analysis: Bearish
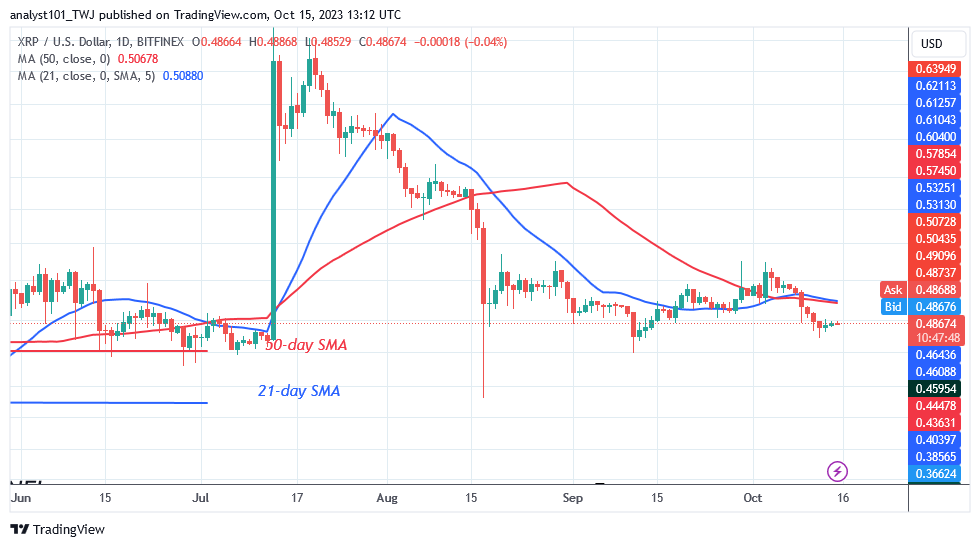
XRP’s (XRP) price has fallen below the moving average lines as it holds above $0.47. The altcoin was rejected on October 3, which indicates that there is pressure to sell. The cryptocurrency dropped to a low of $0.47 on October 12 after breaching below the moving average lines. The selling pressure has decreased over the last four days as the altcoin begins consolidation above the $0.47 level.
At the time of writing, the price of XRP is $0.48. On the downside, XRP/USD will begin its range-bound move between $0.45 and $0.55 price levels if the existing support holds. On the other hand, if selling pressure persists and the current support is broken, XRP will further drop in price to a low of $0.45 or $0.42.
Technical Indicators:
Major Resistance Levels – $1.00, $1.50, $2.00
Major Support Levels – $0.50, $0.30, $0.10
XRP (XRP) Indicator Analysis
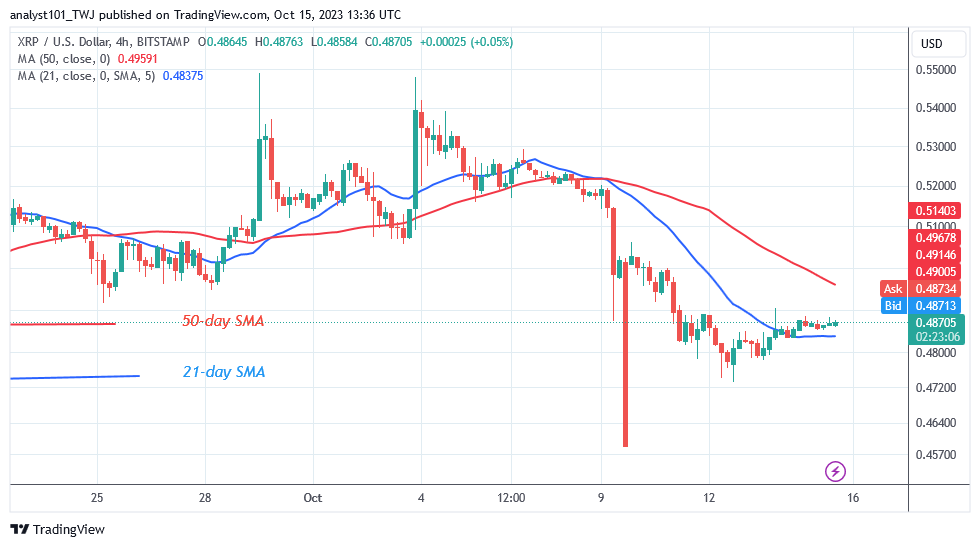
The moving average lines are below the price bars, indicating bearish exhaustion for the crypto asset. The price couldn’t have fallen any lower thanks to the Doji candlesticks. On the 4-hour chart, the price bars for the altcoin are positioned between the moving average lines. It implies that the market will keep fluctuating in a range.
What Is the Next Direction for XRP (XRP)?
The cryptocurrency asset has rebounded as it holds above $0.47. The altcoin will likely continue to fluctuate between $0.45 and $0.55. The range-bound levels need to be broken after the price decrease on August 17. The price movement has been slowed down by the Doji candlesticks. These candlesticks demonstrate traders’ disinterest in the movement of the market.
You can purchase crypto coins here. Buy LBLOCK
Note: Cryptosignals.org is not a financial advisor. Do your research before investing your funds in any financial asset or presented product or event. We are not responsible for your investing results