XRP Is on the Rise as It Revisits The $0.55 High
Estimated Reading Time: 2 minutes
Don’t invest unless you’re prepared to lose all the money you invest. This is a high-risk investment and you are unlikely to be protected if something goes wrong. Take 2 minutes to learn more

XRP (XRP) Long-Term Analysis: Ranging
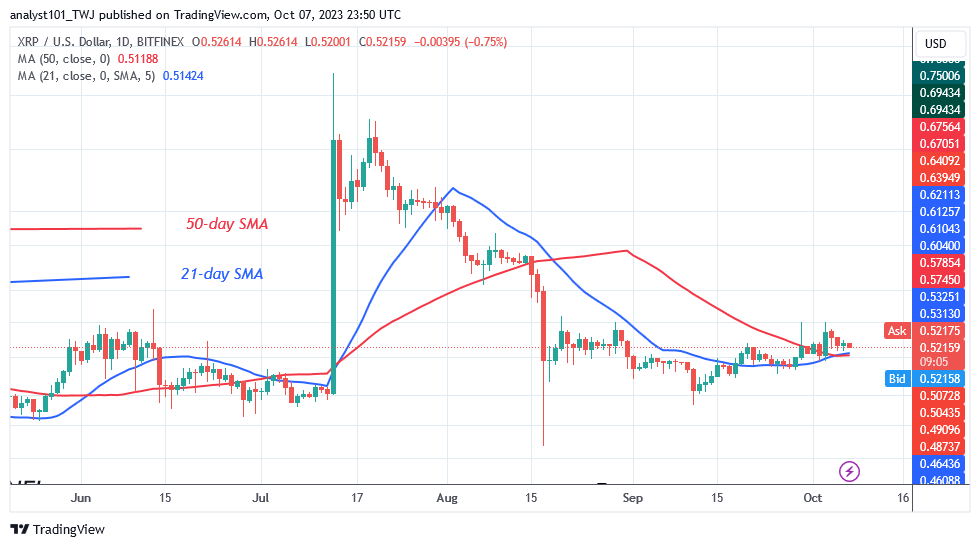
XRP (XRP) is making a series of higher highs and higher lows as it revisits the $0.55 high. When the cryptocurrency retested the resistance at $0.55, price movement halted. The altcoin has retraced above the moving average lines. The resistance at $0.55 has been preventing price growth since August 17. Four attempts by buyers to keep the price above the $0.55 high have been rejected.
The market has overbought near the most recent high. However, if XRP bounces back, the altcoin will move above the resistance at $0.55. The positive momentum will continue up to the $0.64 high. The XRP/USD is now range-bound between $0.45 and $0.55.
Technical Indicators:
Major Resistance Levels – $1.00, $1.50, $2.00
Major Support Levels – $0.50, $0.30, $0.10
XRP(XRP) Indicator Analysis
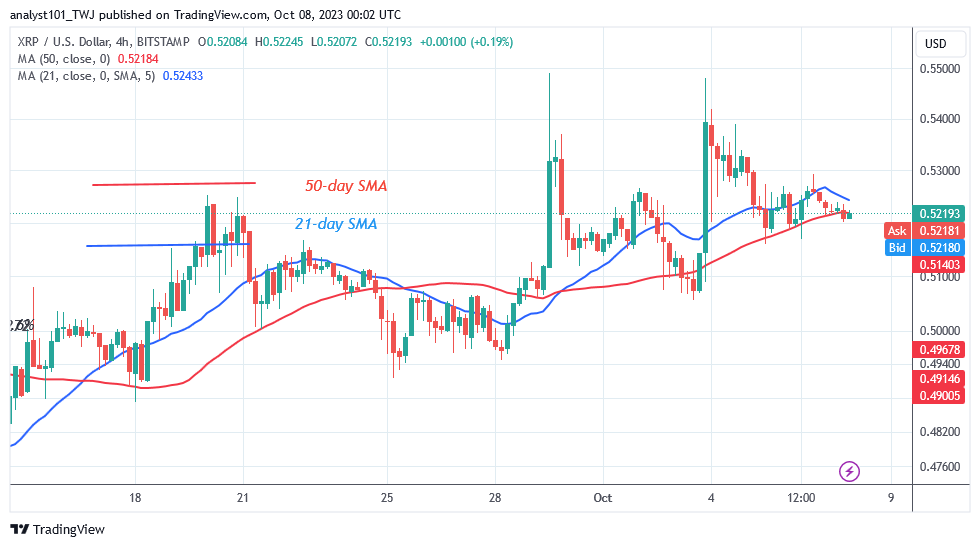
The price bars are currently above the moving average lines, which could enable the altcoin to keep advancing in the direction of higher highs and higher lows. The 21-day SMA crosses above the 50-day SMA, suggesting a bullish order, and this signals a bullish crossing for the cryptocurrency asset.
What Is the Next Direction for XRP (XRP)?
The crypto asset has broken above the moving average lines while being in a sideways trend as it revisits the $0.55 high. Buyers have made multiple unsuccessful attempts to reinstate a bullish trend throughout the prior price action. A price recovery will indicate the start of an uptrend on the upside.
You can purchase crypto coins here. Buy LBLOCK
Note: Cryptosignals.org is not a financial advisor. Do your research before investing your funds in any financial asset or presented product or event. We are not responsible for your investing results