Ethereum’s Rising Movement Halts As It Struggles With The $1,700 High
Estimated Reading Time: 2 minutes
Don’t invest unless you’re prepared to lose all the money you invest. This is a high-risk investment and you are unlikely to be protected if something goes wrong. Take 2 minutes to learn more

Ethereum Price Long-Term Analysis: Bearish
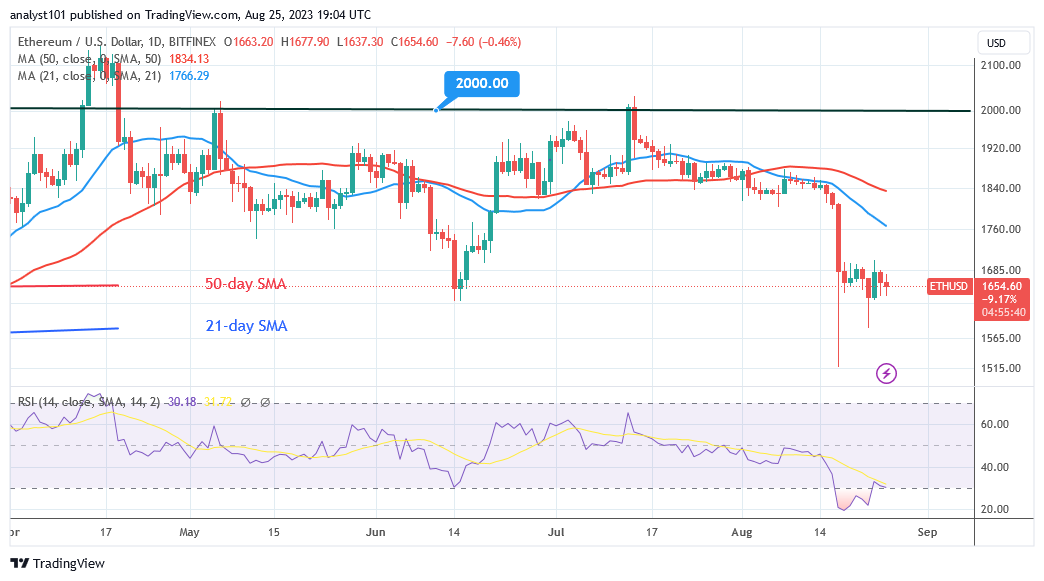
Ethereum (ETH) price is constrained to a narrow range as it struggles with the $1,700 high. . Price fluctuation has been confined between $1,600 and $1,700 since August 17. On August 22, Ether surged past the current support level, reaching a high of $1,700. The positive momentum failed to break through the initial resistance, and the altcoin remained range-bound.
The altcoin is fluctuating and retesting the June 14 historical price level. On June 14, Ether hit a low of $1,629 before rebounding above the present support. The market reached a high of $2,000 in price. The rising movement has now been retrained in the Doji candlesticks.
Technical indicators:
Major Resistance Levels – $2, 600, $2,800, $3,000
Major Support Levels – $1.600, $1, 400, $1,200
Ethereum Indicator Analysis
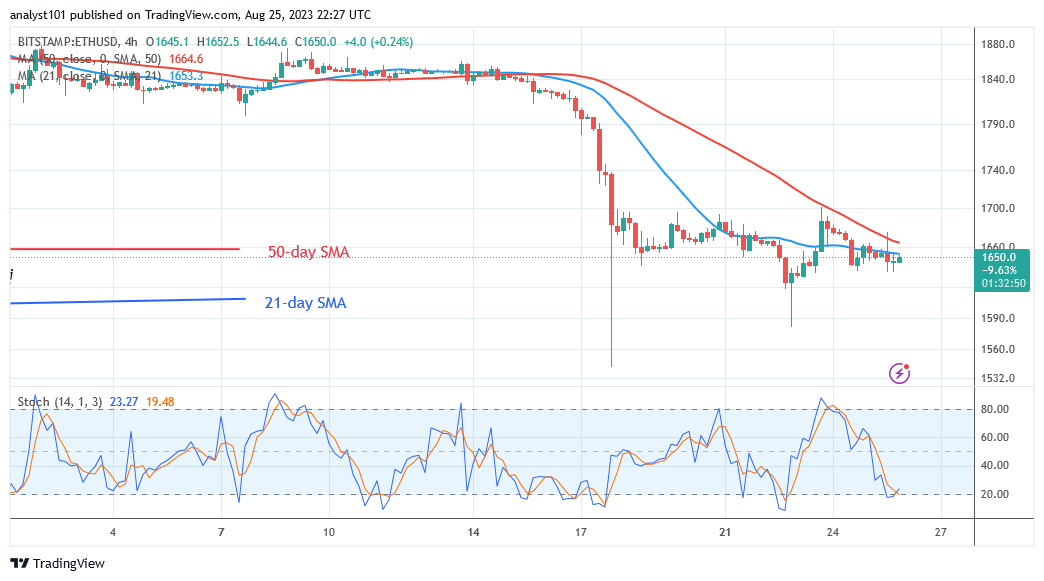
Ether has stayed in the oversold territory at level 29 of the Relative Strength Index for period 14. The altcoin is trading just above the current support level. Furthermore, the selling pressure has achieved bearish fatigue as the cryptocurrency maintains its range-bound movement. Ether is in a bearish trend below the daily Stochastic threshold of 25.
Conclusion
Following the price fall on August 17, Ethereum has resumed a sideways trend as it struggles with the $1,700 high. Traders are restricted to the price levels of $1,600 and $1,700. When buyers or sellers break the range-bound levels, the coin will trend.
You can buy crypto coins here. Buy LBLOCK
Note: Cryptosignals.org is not a financial advisor. Do your research before investing your funds in any financial asset or presented product or event. We are not responsible for your investing results