Uniswap (UNI/USD) Trade Is on a Rise, Holding Steady Below $8
Estimated Reading Time: 3 minutes
Don’t invest unless you’re prepared to lose all the money you invest. This is a high-risk investment and you are unlikely to be protected if something goes wrong. Take 2 minutes to learn more

Uniswap Price Prediction – December 28
There has been a positive path maintained by bulls in the UNI/USD market activities, as the bargaining situation currently portends that the crypto-economic trade is on a rise, holding steady below $8.
Long-position placers will need to exert a great deal of effort to drive the market farther north in a consolidation fashion from its current trading position of $7.35 or so. Seeing that attitude materialize, it is imperative that the trade point of approximately $6.50 is not exceeded in a sustainable southerly direction very soon.
UNI/USD Market
Key Levels:
Resistance levels: $8, $8.50, $9
Support levels: $6, $5.50, $5
UNI/USD – Daily Chart
The UNI/USD daily chart reveals that the crypto economy is on the rise, holding steady below the resistance line of $8.
The trend lines of the Bollinger Bands have been positioned northwardly, indicating that major trade zones have been built between $8 and $5.50. The smaller value indicates the actual underlying spot that will serve as the core point against seeing more irrational reactions if bulls tend to give a worse succumb. The stochastic oscillators have penetrated the overbought region to establish that buying gravity has reached a notable optimal degree and that buyers should be careful of making further pushes.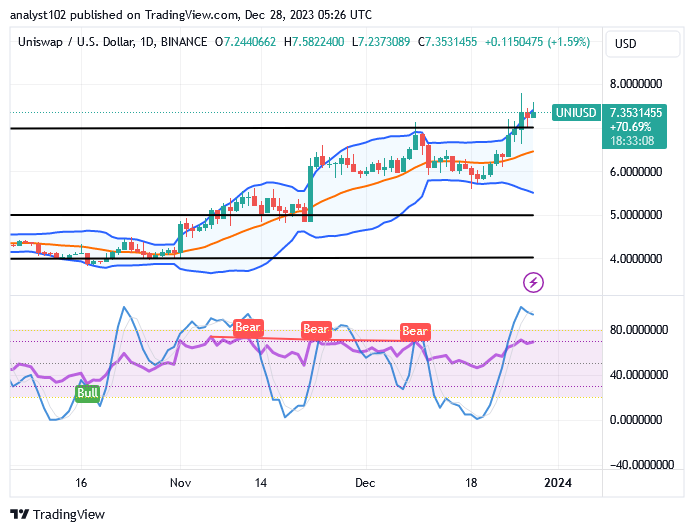
From a technical standpoint, should buyers keep staging new purchases while the UNI/USD market is now trading at a discount of almost $7?
As of the time of this analytics write-up, the UNI/USD market has been having a formidable trade pattern that is ideally logical to give a sell entry if bulls plan to go for a pause on a long-term basis, just as the crypto trade is on a rise, holding steady below the $8 resistance point.
If the current setup is any indication, long-position takers will seem to be exercising patience in order to avoid being whipsawed. Before the rebound stages back into the motion afterwards, a line of falling pressures is likely to form in the mode of lighter lengths to the downside to give possibility to a correction-like situation.
It is anticipated that sales will occur below or near the $8 barrier trade line. Before clicking the execution button, short position holders should watch out for misleading northward pulls that yield rejections around the value line.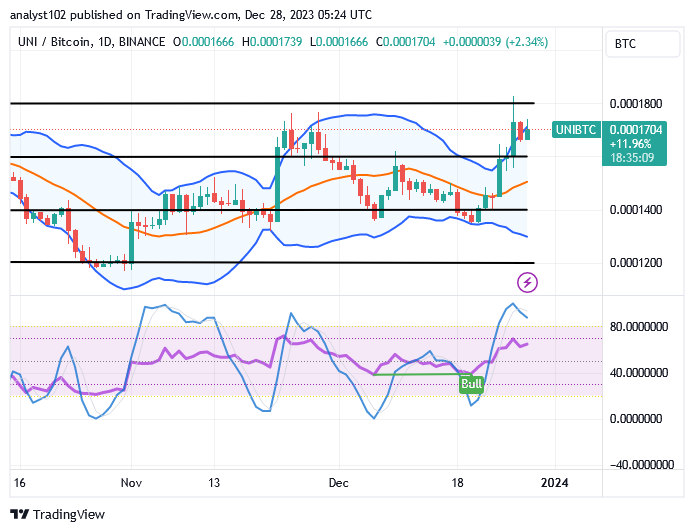
UNI/BTC Price Analysis
In contrast, the market stance of Uniswap against the worth of Bitcoin is on the rise, holding steady below the upper Bollinger Band.
The Bollinger Bands’ trend lines are gradually and consistently veering northward, suggesting that certain mounting gravitational pressures are being restrained. The blue line of the stochastic oscillators has moved into the overbought region. If buyers are going to weigh the positive index of the base economy against its quotient counterpart again, it would be reasonable to wait until the oscillators go back down into lower zones.
\
Note: Cryptosignals.org is not a financial advisor. Do your research before investing your funds in any financial asset or presented product or event. We are not responsible for your investing results.
You can purchase Lucky Block here. Buy LBLOCK