Litecoin (LTC/USD) Daily Price Prediction For February 1: $100 Price Level Is Within Reach
Estimated Reading Time: 2 minutes
Don’t invest unless you’re prepared to lose all the money you invest. This is a high-risk investment and you are unlikely to be protected if something goes wrong. Take 2 minutes to learn more
The Litecoin market has continued to trend in an upward direction since the beginning of the year. But by the middle of January, when the market hit a major resistance level at $90, the price started to range sideways. And for most of the second half of the month, buyers continued to mount pressure on the position of the sellers at $90 price levels.
LTC/USD Price Statistic
- LTC/USD price now: $95.7
- LTC/USD market cap: $6,909,241,515
- LTC/USD circulating supply: 72,183,403
- LTC/USD total supply: 84,000,000
- LTC/USD coin market cap rank: #13
Key Levels
- Resistance: $100, $110, $120
- Support: $90, $85, $80
Price Prediction for Litecoin: A Look at the Indicators
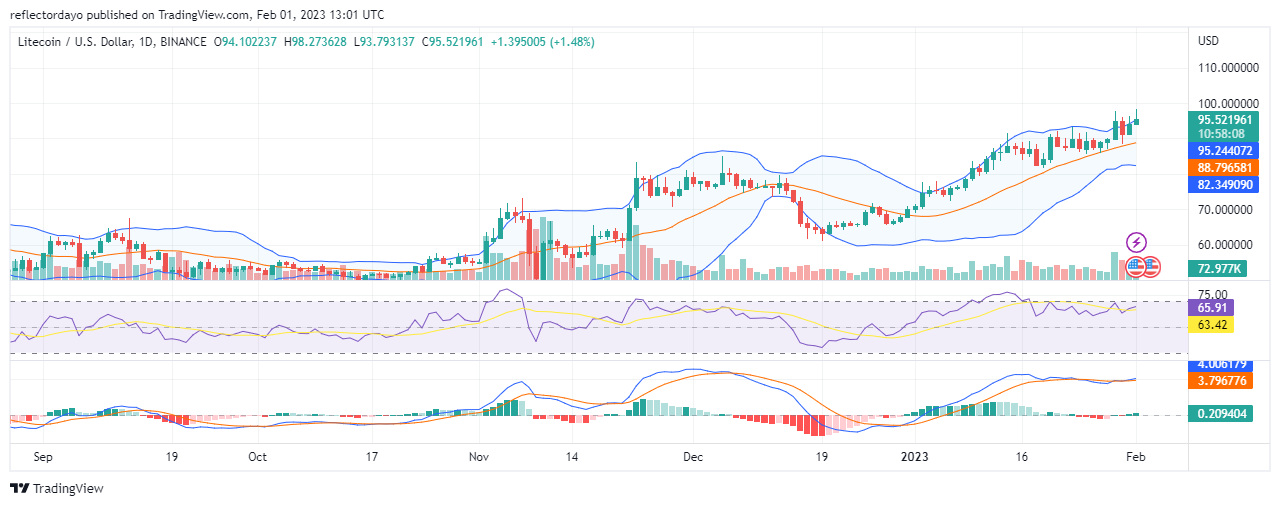
From the chart, between the middle of January and the end of January, an ascending wedge triangle pattern formed. And these bullish activities culminated in a bullish price breakout. As expected, the bull market broke the resistance on the 29th of January, and they established a new support level above the $90 price level. According to the Bollinger Bands indicator, the bull market needs to deal with bearish resistance, which has shifted to around the $96 level. Although the Bollinger indicator portrays an upward-moving price channel, we can still notice slight bearish activities reflected by the lower band of the indicator. Bears are forced to yield ground to the bullish pressure.
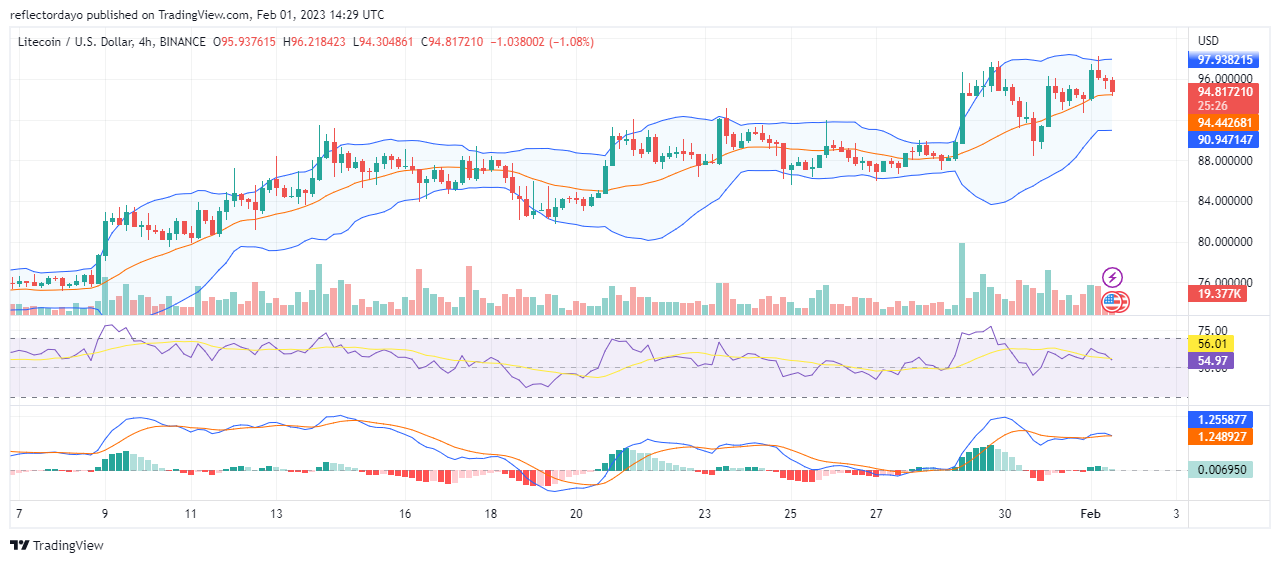
LTC/USD 4-Hour Chart Outlook
A smaller timeframe view of the market shows that the bears are catching up with the bulls. The bulls have almost lost all the ground that the one bullish move that opened the first 4-hour session of today’s market has achieved. The current price is near the point of market equilibrium. However, there is a greater likelihood that the bullish trend will resume because the general movement of the price channel is to the upside.