Sponge/USD ($SPONGE) Demonstrates Resilience at $0.0000976 Amid Bullish Sentiment
Estimated Reading Time: 3 minutes
Don’t invest unless you’re prepared to lose all the money you invest. This is a high-risk investment and you are unlikely to be protected if something goes wrong. Take 2 minutes to learn more
The $SPONGE market has maintained the possibility of a bounce at the $0.000096 price level for a couple of days. But the market’s recovery is now unfolding at a slightly elevated support level, precisely at $0.0000976. However, the certainty surrounding the market’s ability to uphold this newfound support and sustain its recovery remains uncertain. There is a plausible scenario in which the market may revisit the $0.000096 level before resuming its upward trajectory.
Key Levels
- Resistance: $0.000115, $0.000120, and $0.000125.
- Support: $0.00010, $0.000090, and $0.000080.
Sponge (SPONGE/USD) Price Analysis: Insights from Indicators
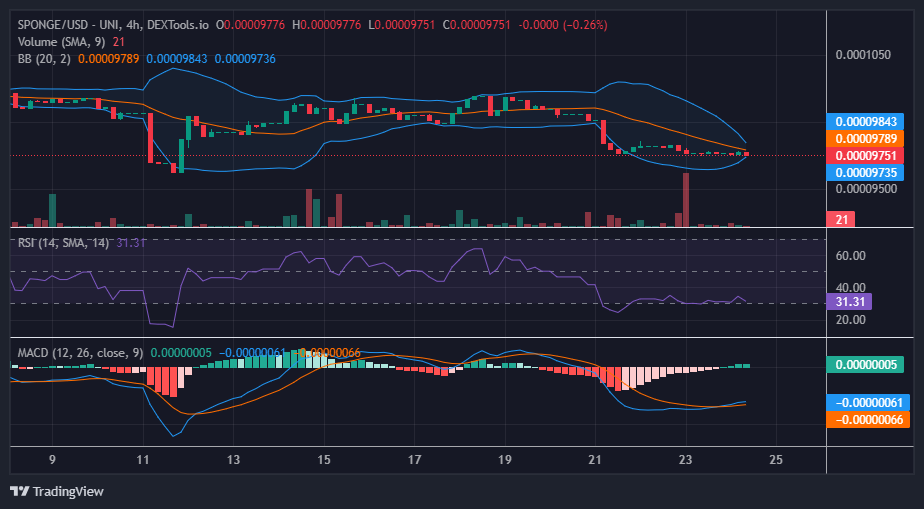
While there is an anticipation of a rebound at the pivotal $0.000096 level, the $SPONGE market has thus far been unable to materialize this expectation. This can be attributed to the recent formation of an inverted hammer pattern and the market’s consolidation near $0.000097 on the 4-hour chart. This pattern implies a tussle between supply and demand at the crucial support level.
Furthermore, the Relative Strength Index (RSI) is indicating a relatively gradual pace of recovery for the market, with the RSI line hovering around the edge of the hedge of the oversold region. When considered alongside the presence of the inverted hammer pattern, there is a compelling argument that the market could face challenges in maintaining its current recovery. It’s conceivable that the bulls may regroup, focusing their efforts around the crucial $0.000096 price level.
$SPONGE Short-Term Outlook: 1-Hour Chart
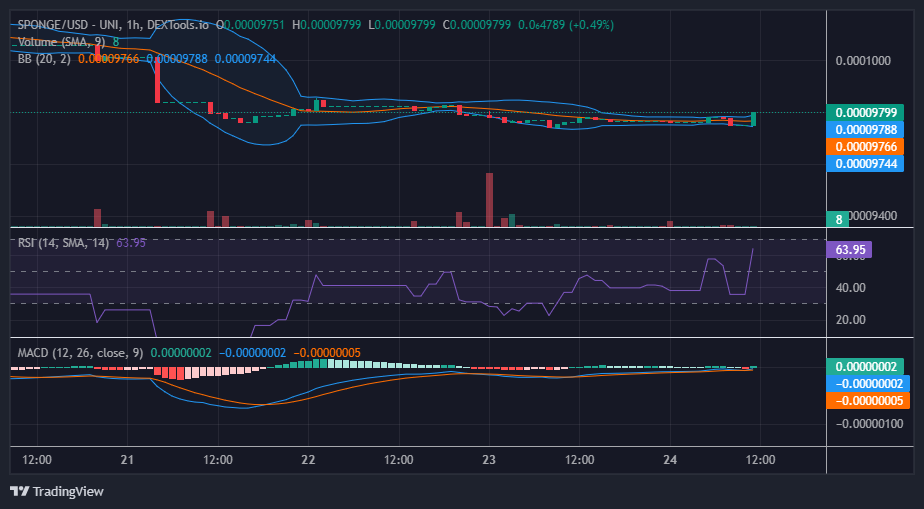
Upon thorough scrutiny of the 1-hour chart, it becomes evident that the boost in trading volume during the last daily trading session likely played a role in establishing the $0.0000976 support level and maintaining stability around this level. Furthermore, a resistance barrier has emerged at $0.00009844, though it has been unable to maintain its position above this price level.
Moreover, the Bollinger Bands indicator indicates signs of convergence, resulting in the formation of a narrow price channel for this relatively stagnant market. This suggests a contraction in volatility and implies the potential for an imminent price breakout.
Start trading SPONGE on Uniswap now!
🧽 Dive into the waves with $SPONGE and soak up the action! 💦
🧽 Start trading #SPONGE on @Uniswap now! 🚀🔄
🧽 Explore the trading experience: https://t.co/YQSTwxWjw3 pic.twitter.com/N5tRYOHjIC
— $SPONGE (@spongeoneth) September 24, 2023
Invest in the hottest and best meme coin. Buy Sponge ($SPONGE) today!