Sponge/USD ($SPONGE) Bull Market Bounces Back at $0.0000976
Estimated Reading Time: 3 minutes
Don’t invest unless you’re prepared to lose all the money you invest. This is a high-risk investment and you are unlikely to be protected if something goes wrong. Take 2 minutes to learn more
In our prior analysis, there was speculation regarding a potential SPONGE/USD market rebound at the critical price point of $0.000096. Surprisingly, the recovery appears to be unfolding at a slightly higher support level, precisely at $0.0000976. Nevertheless, the certainty of the market maintaining this newfound support and sustaining its recovery remains uncertain. It is plausible that the market could ultimately revert to the $0.000096 level to resume its recovery path.
Key Levels
- Resistance: $0.000115, $0.000120, and $0.000125.
- Support: $0.00010, $0.000090, and $0.000080.
Sponge (SPONGE/USD) Price Analysis: Insights from Indicators
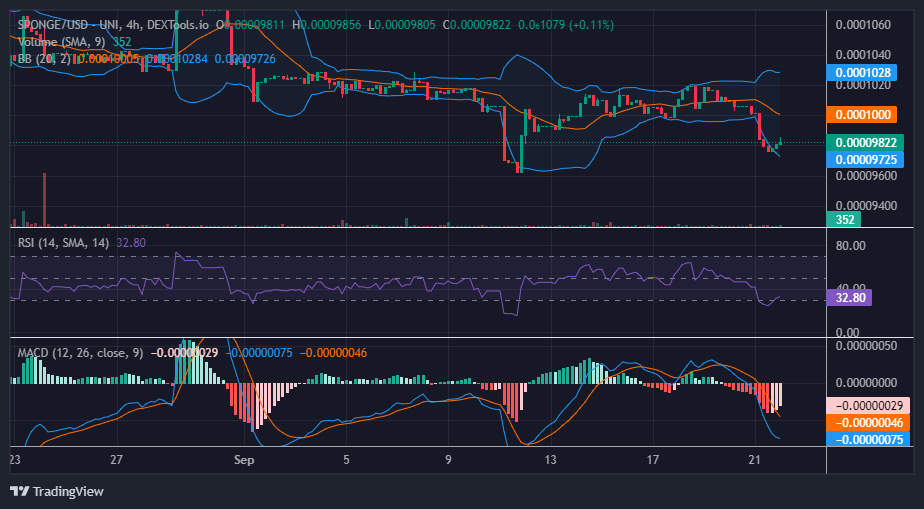
The sustainability of the SPONGE/USD bullish recovery is currently in question due to the recent formation of an inverted hammer pattern on the 4-hour chart. This pattern suggests that the market has encountered significant resistance during its recovery, potentially leading to consolidation around this new support level, provided it proves to be robust, or a resurgence of bullish activity around the key support level.
Additionally, the Relative Strength Index (RSI) indicates a relatively slow pace of recovery for the market, with the RSI line hovering around 33. When coupled with the presence of the inverted hammer pattern, there is a compelling argument that the market may struggle to maintain its recovery at this juncture. It is conceivable that the bulls may regroup, focusing their efforts around the critical $0.000096 price level.
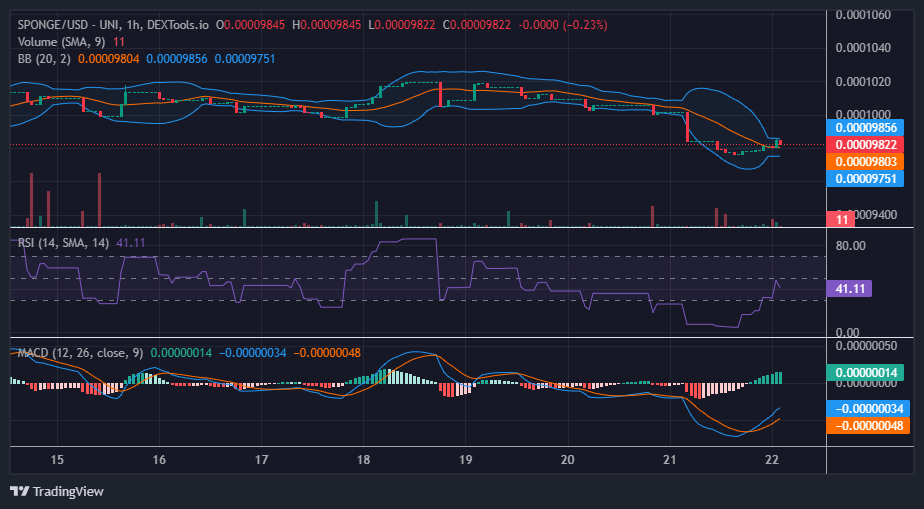
$SPONGE Short-Term Outlook: 1-Hour Chart
Upon close examination of the 1-hour chart, it becomes apparent that an increase in trading volume has likely contributed to the establishment of the $0.0000976 support level. Additionally, a resistance barrier has formed at $0.00009844. Despite the price correction, the market’s current position remains above the 20-day moving average, indicating the prevailing strength of bullish sentiment, at least for the time being.
Furthermore, the Bollinger Bands indicator is showing signs of convergence, suggesting a tightening of volatility, akin to a squeeze. This often foreshadows an imminent and distinct price breakout in the market.
Start trading $SPONGE on Poloniex today!
🧽 Calling all #SPONGE enthusiasts! 🌊
🧽 Start trading $SPONGE on #Poloniex today!💰🚀
🧽 Don’t delay, absorb all the damp! 💧🎉https://t.co/PNn3dHQK8n pic.twitter.com/QaJG12H212
— $SPONGE (@spongeoneth) September 22, 2023
Invest in the hottest and best meme coin. Buy Sponge ($SPONGE) today!