Dogecoin (DOGE) Price Prediction: DOGE Bulls Hit a Strong Wall
Estimated Reading Time: 3 minutes
Don’t invest unless you’re prepared to lose all the money you invest. This is a high-risk investment and you are unlikely to be protected if something goes wrong. Take 2 minutes to learn more

It could be seen that the Dogecoin market strongly corrected upwards in two trading sessions. This occurred over the past three sessions. However, the price movement is facing the challenge of extending that move at this point.
Dogecoin (DOGE) Price Prediction: May 6
On the daily price chart for Dogecoin, we can see that price action has seen some impressive movement. Having retraced above the Guppy Multiple Moving Average (GMMA) lines, the market has the chance of continuing. However, the token is facing an initial challenge at a key resistance, which poses a moderate challenge.
DOGE/USDT Long-term Trend: Bullish (Daily Chart)
Key Levels:
Resistance Levels: $0.1600, $0.1800, and $0.2000
Support Levels: $0.1500, $0.1300, and $0.1100
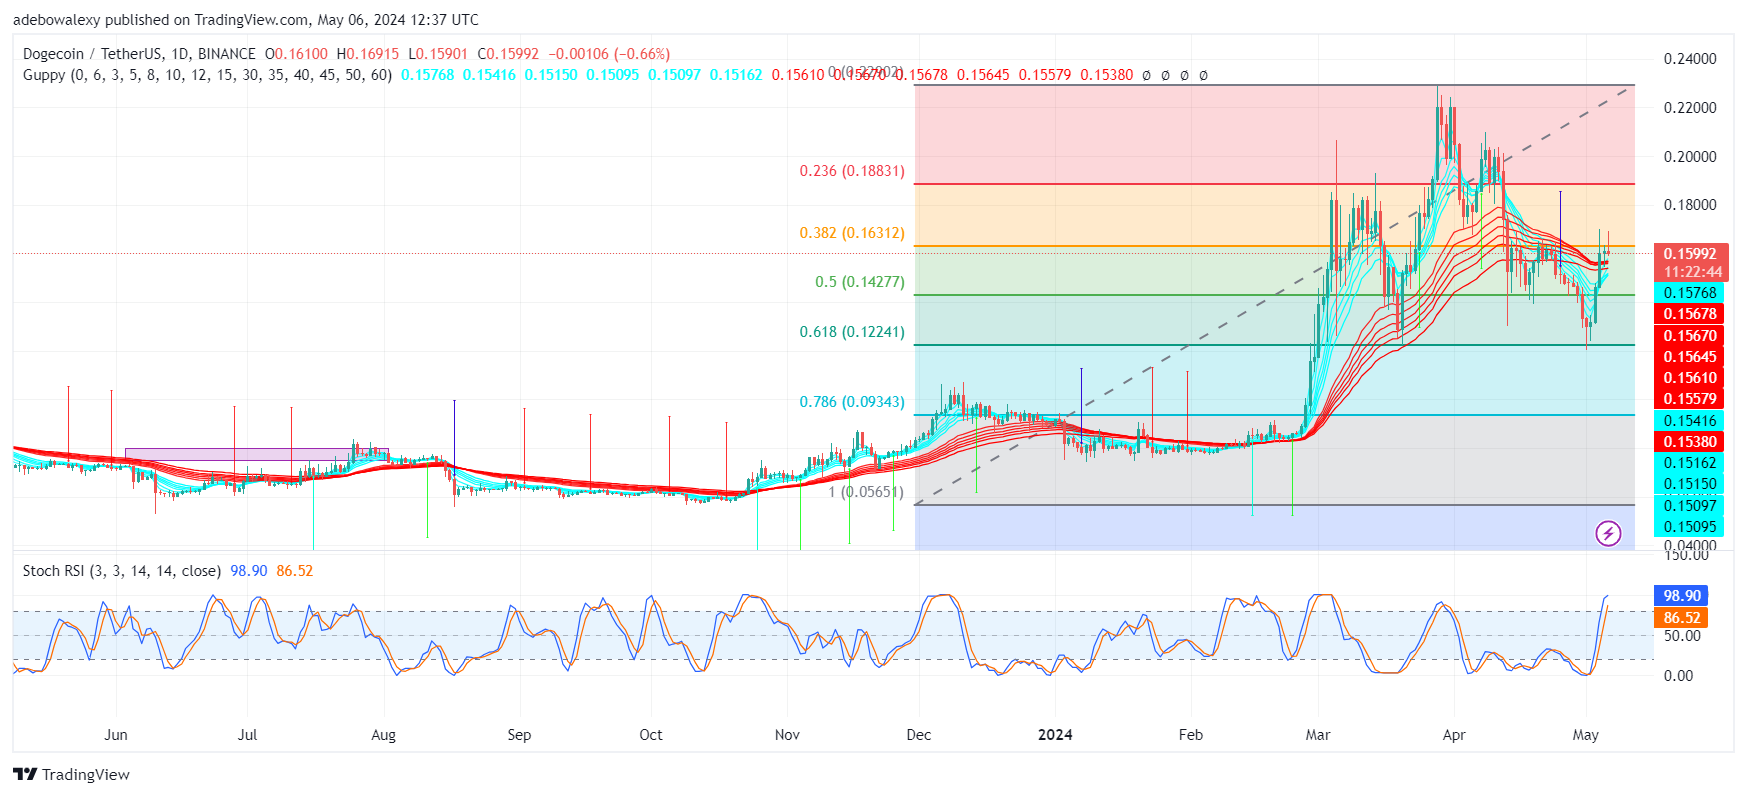
DOGE/USDT: Daily Chart
Dogecoin’s Price action has risen past the crossed lines of the GMMA indicator lines. Consequently, this suggests that the trend may continue. This is because the crossing lines of the GMMA indicator lines will suggest that the uptrend may strengthen, as more traders may pick up the signs and enter at this point. Meanwhile, the Stochastic Relative Strength Index (SRSI) indicator has reached the overbought region. The bent leading line of the indicator suggests a possible trend reversal, which, by inspection, hasn’t gained much ground.
Dogecoin Price Prediction: What May Result from This Market?
In the daily chart, it could be seen that price action has a general upside trajectory. Nevertheless, it could be seen that the market had faced rejection at the 38.20 Fibonacci Retracement level. Be that as it may, trading activities are still occurring above the GMMA indicator. The last price candle on this chart suggests that market forces are contesting for control of market direction.
The SRSI indicator lines are now in the overbought region. However, the change in the trajectory of the leading SRSI indicator lines somehow suggests that headwinds are exerting some pressure. However, it could be seen that price action is favorably positioned above the GMMA lines. As a result, traders can still anticipate that the trend will likely extend further upward.
DOGE/USDT Medium-term Trend: Headwind Threatens But Seems Weak (4-H Chart)
Moving to a Dogecoin 4-hour market, it could be seen that price action has continued towards lower levels, for the second consecutive session. Meanwhile, it could be observed that the momentum is weak, considering the size of the price candle. The SRSI indicator on this price chart can be seen to have fallen significantly into the oversold region.
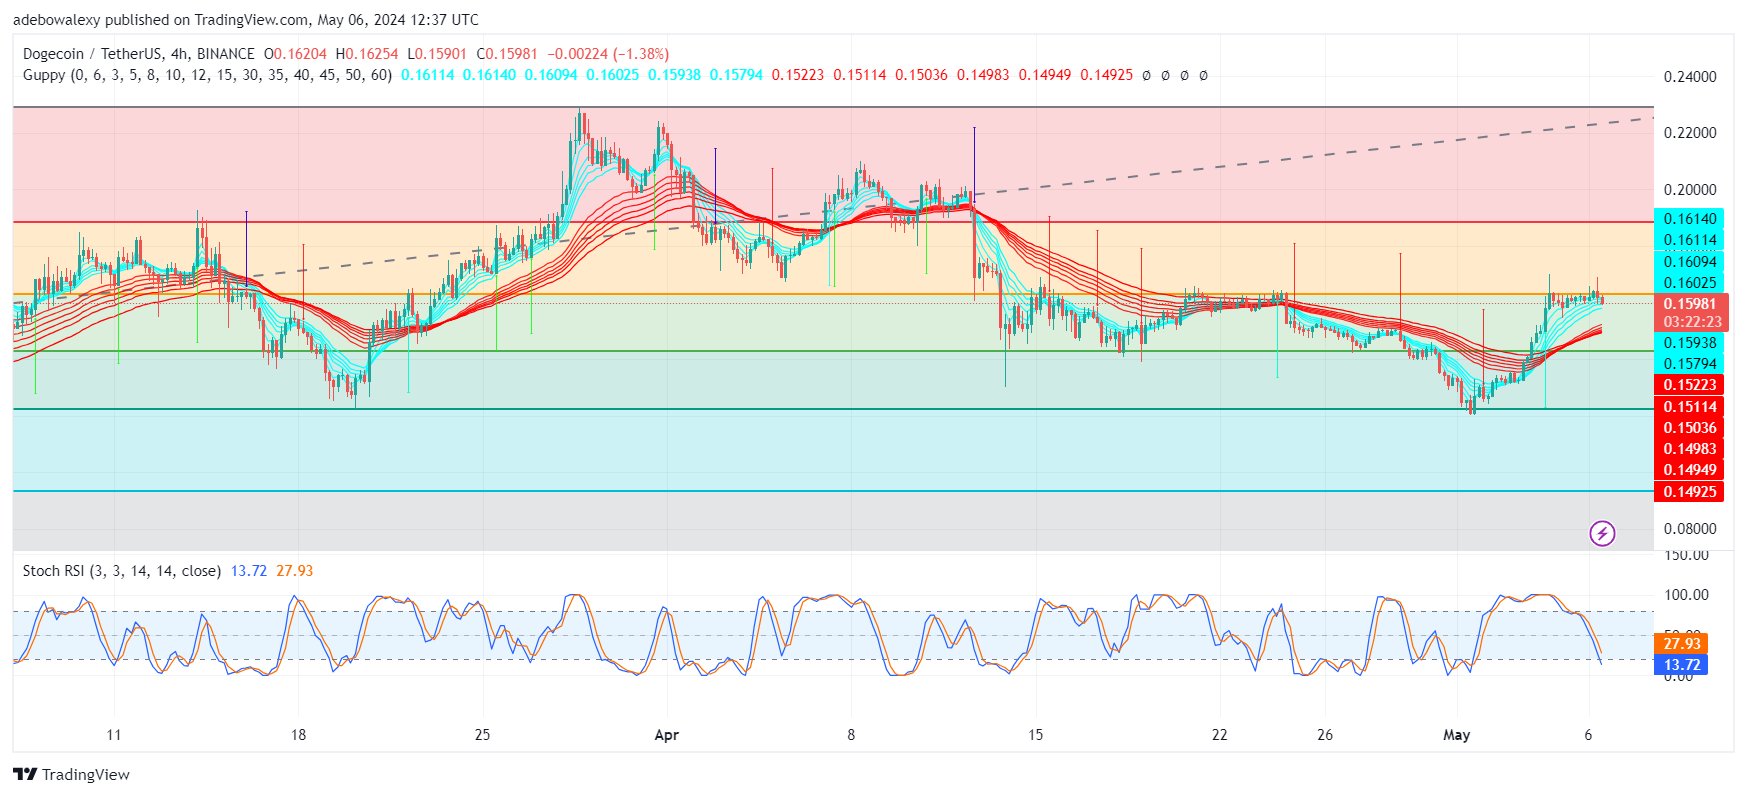
Indications from this price chart suggest the downward correction is weak, yet it may continue towards the $0.1560 or $0.1570 mark. Afterward, a possible continuation of the upside correction may result in the $0.1750 mark in the near term.