Arbitrum Price Prediction: ARB/USD Exhibits Signs of Recovery in a Persistent Downtrend
Estimated Reading Time: 3 minutes
Don’t invest unless you’re prepared to lose all the money you invest. This is a high-risk investment and you are unlikely to be protected if something goes wrong. Take 2 minutes to learn more
Arbitrum Price Prediction: August 27, 2024
The ARB/USD has been in a prolonged downtrend, with many support lines turning into resistance levels. Despite the overall bearish trend, the pair is displaying signs of a potential rebound. This can be seen in how the price hovers around the new $0.57 support line.
ARB/USD Long-Term Trend: Bearish (Daily Chart)
Key Levels:
Resistance Levels: $0.61, $1.00, and $1.50
Support Levels: $0.35, $0.50, and $0.57
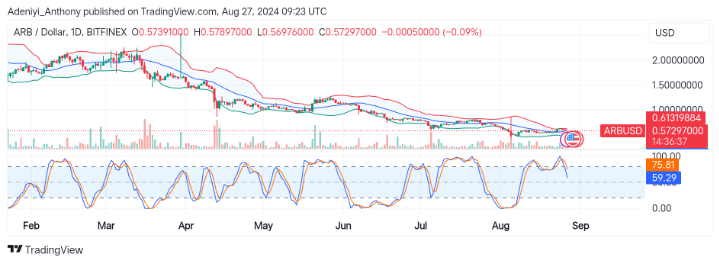
The chart shows a steady downtrend in the ARB/USD pair over seven months, with a fall from its all-time highest ($2.00) to the support level where the price is currently operating. Also, the diagram displays consistency in the volume and a periodic spike suggesting bearish pressure.
Arbitrum Price Prediction: Arbitrum at a Critical Juncture
The ARB/USD pair is currently testing the key support line. However, the overall market condition remains bearish, and the closeness to the oversold regions on the Bollinger Bands and the overbought signal on the Stochastic Relative Strength Index suggests that a short-term reversal could be around the corner.
The pair needs more support from bullish investors because if it fails to hold above $0.57, the price could decline to the next psychological level at $0.50.
Traders should exercise caution and watch closely the key levels for either a continued downtrend or a potential recovery.
ARB/USD Medium-term Trend: Ranging (4H Chart)
The pair on a 4-hour chart shows a range-bound movement, with prices oscillating around $0.57 and $0.63 lately. It shows that the traders in this pair are patiently waiting for a potential breakout, one that may occur for bullish traders if the price breaks above $0.63. On the other hand, a potential breakout may hold for bearish traders if the price falls below the current $0.57 support level.
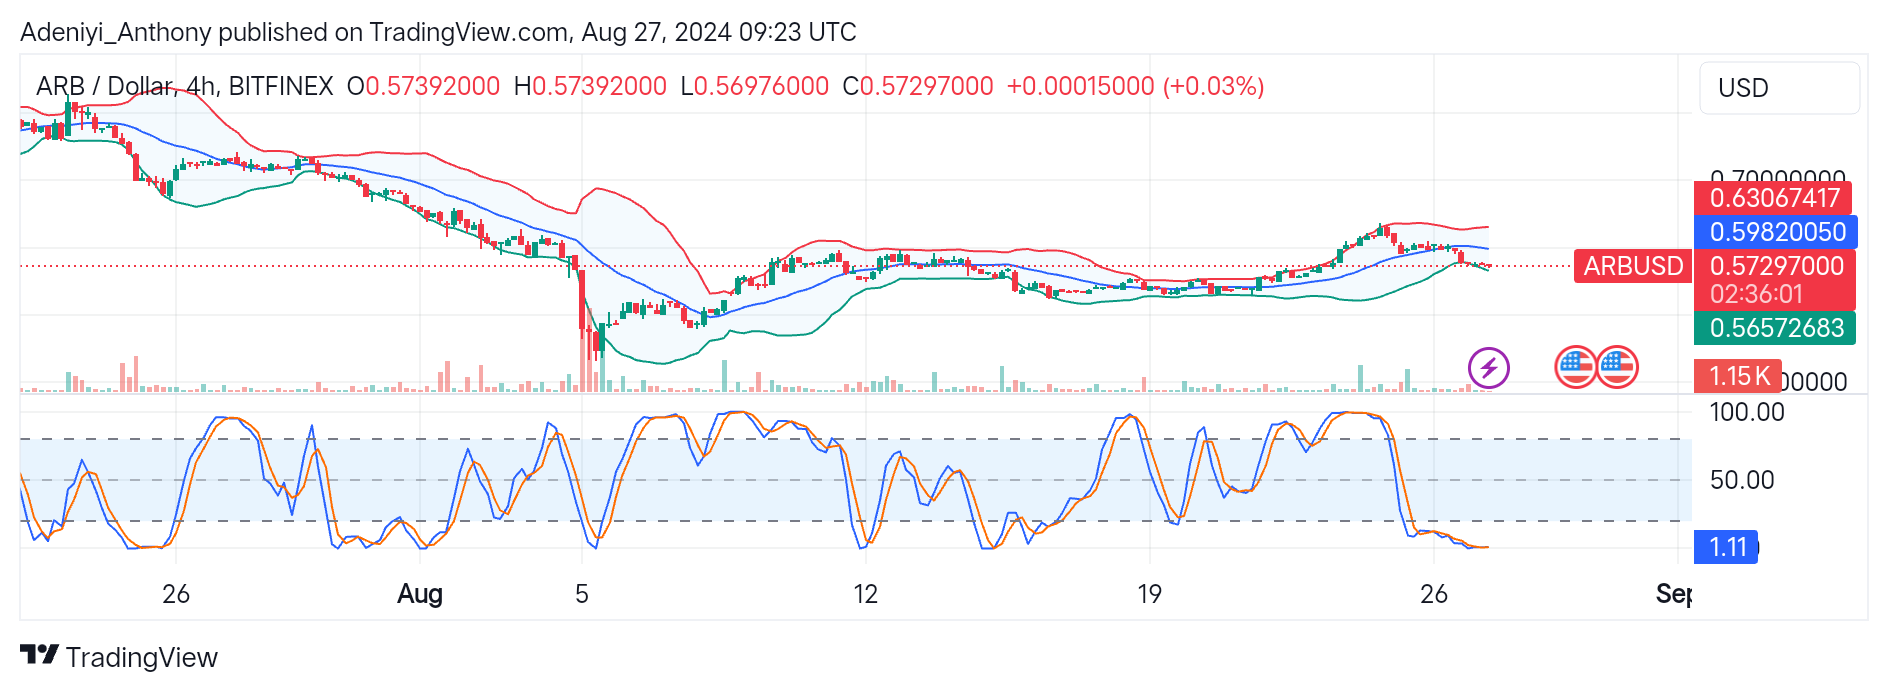
In conclusion, the Bollinger band and stochastic RSI on the ARB/USD 4H chart suggest traders should exercise patience. Price is trading near the middle band on the Bollinger band, which shows a neutral stance. On the other hand, the stochastic RSI displays that the pair is in an oversold position, which means the recent downtrend could be nearing exhaustion.
In order to place winning trades with us via Bybit, you can open an account here.