Solana (SOL/USD) Market Is Maintaining a Point Above $20
Estimated Reading Time: 3 minutes
Don’t invest unless you’re prepared to lose all the money you invest. This is a high-risk investment and you are unlikely to be protected if something goes wrong. Take 2 minutes to learn more
Solana Price Prediction – January 27
Concurrent trading activity has been between the two SOL/USD traders as the crypto-economic market maintains a point above the $20 line. Today’s trading zones have been between $24.53 and $23.31 value lines. As of writing, price bargains around $24.10 at an average negative percentage rate of 1.03 to denote s reduction is on course.
SOL/USD Market
Key Levels:
Resistance levels: $27.50, $30, $32.50
Support levels: $17.50, $15, $12.50
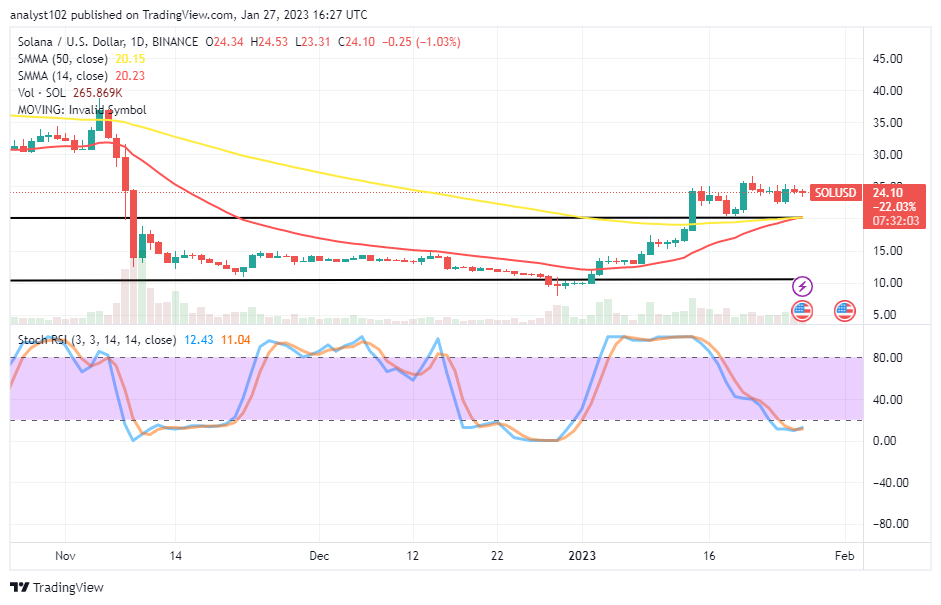
SOL/USD – Daily Chart
The SOL/USD daily chart showcases the crypto market is maintaining a point above the $20 level that could serve as the baseline for making upswings. The long-term support level is put at $17.50 as the 14-day SMA indicator is at $20.23 and $20.15 values, playing a backing role to the point in question. The Stochastic Oscillators are in the oversold region, with their lines forming a conjoint mode at 11.04 and 12.43 levels. A bearish candlestick is in the making to signal that consolidation may play out at the current capacity-trading level.
What stance should SOL/USD market traders take in light of the present trading capacity outlook?
Expectantly, the SOL/USD buying force will potentially sustain over the $20 psychological line as the crypto market is to maintain a point above the value line. There may also be a range of movements to indicate in-active motions between the two major movers. But, violent southward breaches against the points of the SMA trend lines will push the moves into a declining trend following the days it will happen.
On the downside of the technical analysis, going by the reading stance of the Stochastic Oscillators, the weight to add to the pushes of bears to the downside is gradually reduced to a lower-trading zone that can as well breach further only if bulls fail to reclaim their positions over or around the $20 line. However, that may not be possible shortly. If the price tries to bounce up from around the upper horizontal line, sentiment may shift against seeing more lows.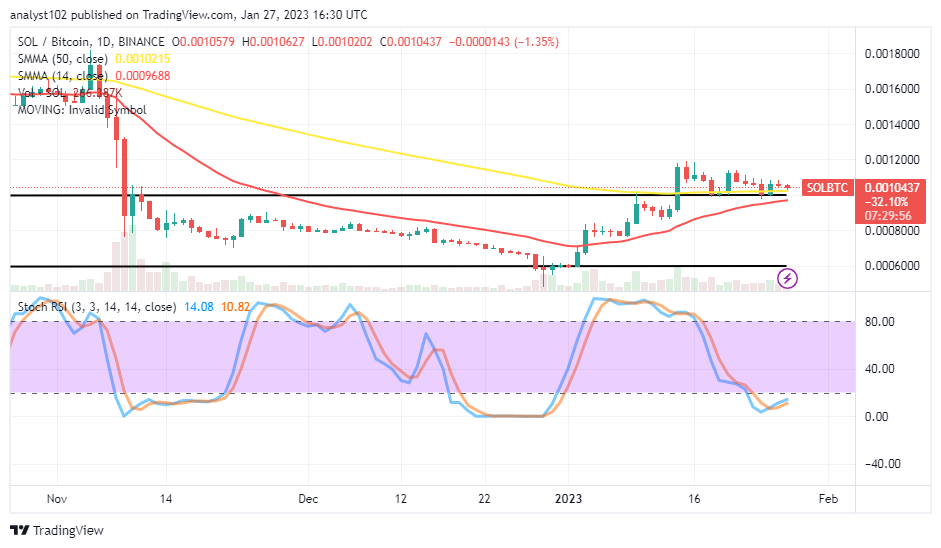
SOL/BTC Price Analysis
Solana’s trending outlook compared with Bitcoin appears, trying to maintain a point above an upper-range trading spot indicated by the horizontal line. The 50-day SMA indicator is trending eastwardly around the upper range-trading spot as the 14-day SMA indicator trends northward close to them from beneath. The Stochastic Oscillators are in the oversold region, trying to cross northbound at 10.82 and 14.08 levels. The base crypto may soon gain strength against the counter-trading crypto.
Note: Cryptosignals.org is not a financial advisor. Do your research before investing your funds in any financial asset or presented product or event. We are not responsible for your investing results.
You can purchase Lucky Block here. Buy LBLOCK