Lucky Block Price Prediction: LBLOCK/USD Gets Ready for a Break Above $0.0015 Level
Estimated Reading Time: 2 minutes
Don’t invest unless you’re prepared to lose all the money you invest. This is a high-risk investment and you are unlikely to be protected if something goes wrong. Take 2 minutes to learn more

Free Crypto Signals Channel
Lucky Block Price Prediction – June 16
According to the chart, the Lucky Block price prediction shows that LBLOCK would rise above the 9-day and 21-day moving averages.
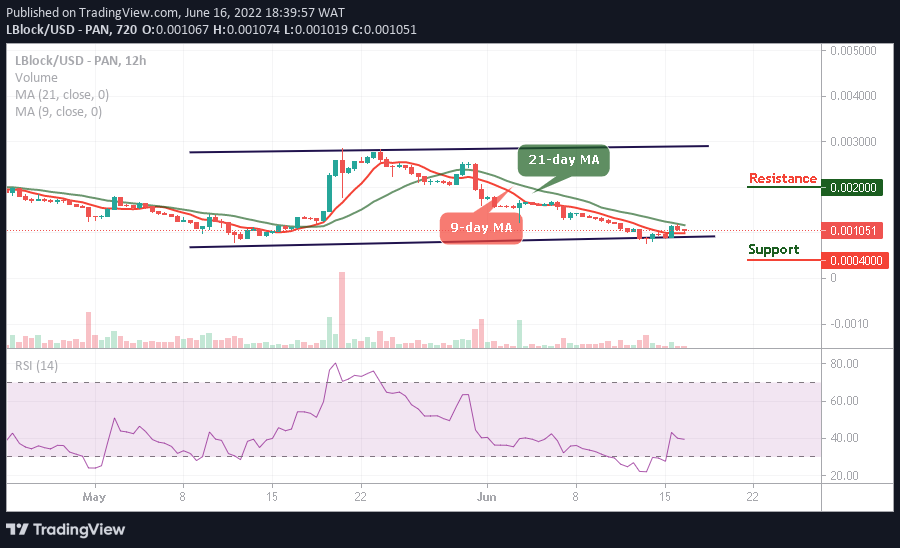
LBLOCK/USD Medium-term Trend: Ranging (12H Chart)
Key Levels:
Resistance levels: $0.0020, $0.0022, $0.0024
Support levels: $0.0004, $0.0003, $0.0002
LBLOCK/USD is attempting to cross above the 9-day and 21-day moving averages as the coin gets ready for additional upsides. Meanwhile, the bullish movement is ready to push the coin towards the resistance level of $0.0015.
Lucky Block Price Prediction: LBLOCK/USD Will Head to the Upside
The Lucky Block price is hovering at $0.0010 where it prepares to cross above the 21-day moving average. If the bulls regroup and put more pressure, LBLOCK/USD will maintain the positive side; any further bullish movement will locate the potential resistance levels at $0.0020, $0.0022, and $0.0024.
On the other hand, any bearish movement below the lower boundary of the channel could locate the support levels at $0.0004, $0.0003, and $0.0002. Moreover, the technical indicator Relative Strength Index (14) remains below the 40-level, crossing above this level will increase the bullish movement.
LBLOCK/USD Medium-term Trend: Bearish (4H Chart)
On the 4-hour chart, the Lucky Block price is consolidating above the 9-day and 21-day moving averages with a bullish candle. On the other hand, the technical indicator Relative Strength Index (14) remains around the 50-level pushing the coin to the upside.
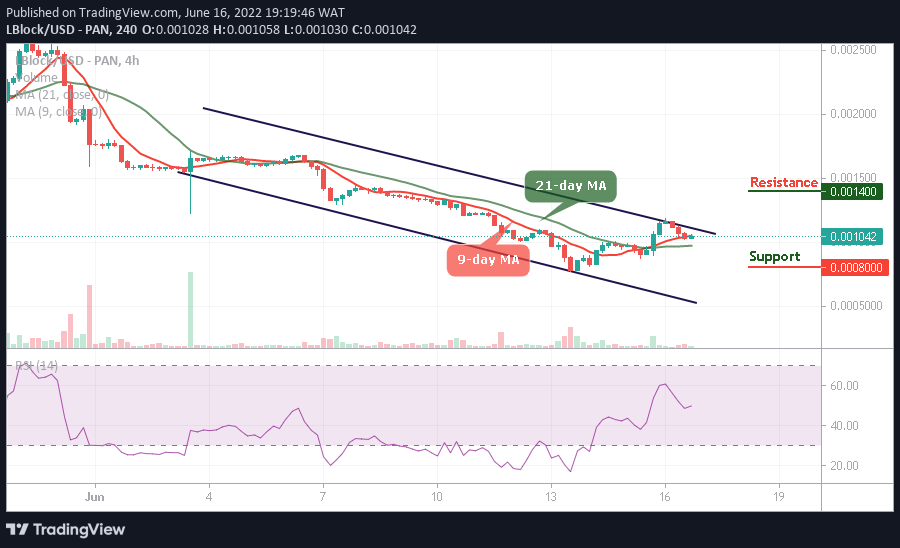
However, any further bullish movement will push LBLOCK/USD above the upper boundary of the channel which will hit the resistance level of $0.0014 and above. On the contrary, if the price drops and crosses below the moving averages, it could hit the critical support at $0.0008 and below, giving more buyers to enter the market.
You can purchase Lucky Block here. Buy LBlock