Quant Price Prediction: Quant (QNT) Shows Signs of Recovery Amid Prolonged Downtrend
Estimated Reading Time: 2 minutes
Don’t invest unless you’re prepared to lose all the money you invest. This is a high-risk investment and you are unlikely to be protected if something goes wrong. Take 2 minutes to learn more

Quant Price Prediction: August 21, 2024
After months of sustained downward pressure, quant appears to be displaying signs of recovery as it hovers near a crucial support zone.
QNT/USD is currently priced at $63.93, reflecting a modest increase, but challenges remain as the market awaits a decisive breakout moment.
QNT/USD Long-term Trend: Bearish (Daily Chart)
Key Levels:
Resistance Level: $66.86, $67.67, and $68.49
Support Level: $63.47, $63.63, and $63.79
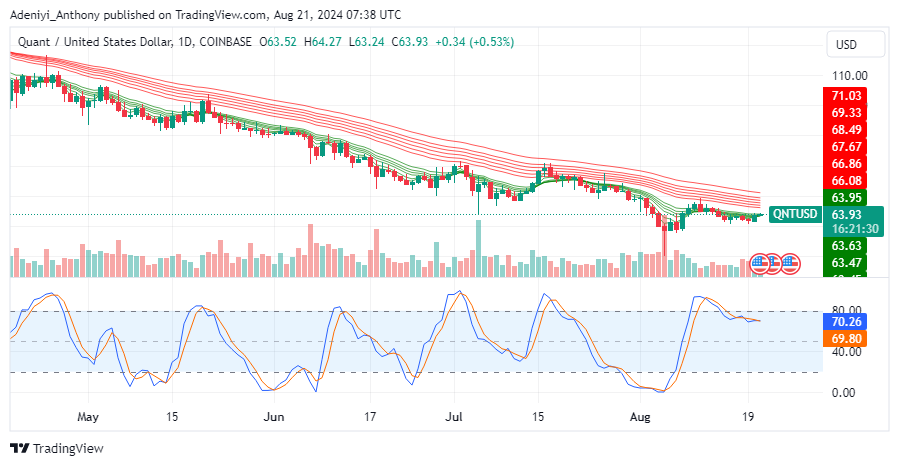
The price of Quant has been in a downtrend for a significant period, as indicated by the consistent lower highs and lower lows on the chart.
The QNT/USD pair is currently trading below the Guppy Multiple Moving Averages (GMMA), suggesting a bearish trend, but the price is attempting a break above them.
Quant Price Prediction: Possibility for Recovery
Though the overall condition of the market remains bearish, the Stochastic Relative Strength Index (SRSI) shows that QNT/USD has crossed above the oversold level and is currently around the 70 level. This suggests that the price might be gaining some bullish momentum, though it is approaching the overbought region, which might lead to a pullback if the price fails to sustain upward momentum. Patience becomes a virtue here.
Quant Price Prediction: QNT/USD Short-term Trend: Ranging (4H Chart)
The 4-hour chart suggests QNT is currently trading below the clusters of GMMA, which are trending downward. This reflects sustained selling pressure, as the market appears to be struggling to break above the nearest resistance line. This could lead to further downside if the bulls do not regain control soon.
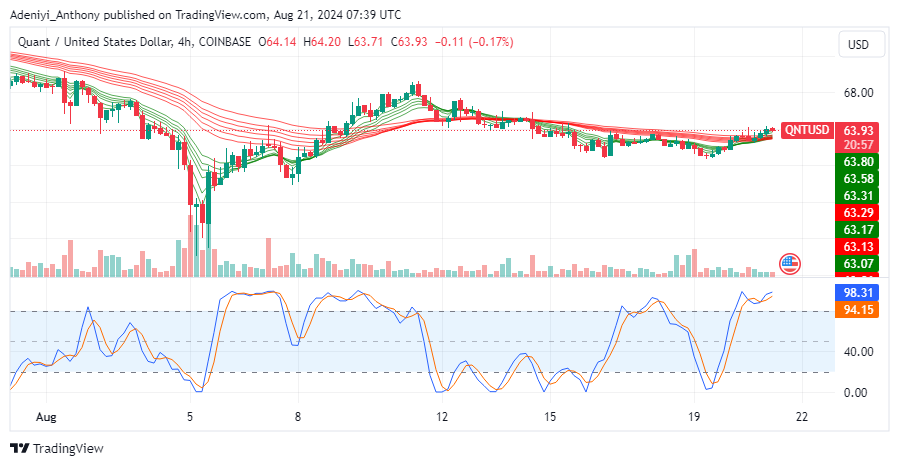
The stochastic RSI suggests the market might face a short-term pullback as buying momentum appears to be waning; this indicates that Quant could be due for a reversal or at least a temporary dip.
The indicators in this timeframe suggest that a short-term rally is possible, but the overall bearish condition remains intact unless significant buying interest emerges to break the prevailing downtrend.
In order to place winning trades with us via Bybit, you can open an account here.