Arbitrum Price Prediction: ARB/USD Showing signs of Recovery After Extended Downtrend
Estimated Reading Time: 2 minutes
Don’t invest unless you’re prepared to lose all the money you invest. This is a high-risk investment and you are unlikely to be protected if something goes wrong. Take 2 minutes to learn more
Arbitrum (ARB) Price Prediction: August 20
The ARB/USD trading pair has been in a prolonged downtrend since the second quarter of the year, with Arbitrum’s price consistently moving southwards. However, a closer look at the chart suggests a potential rebound might be near. Arbitrum will need more bullish strength to break the $0.6041 line.
ARB/USD Long-term Trend: Bearish (Daily chart)
Key levels:
Resistance levels: $0.6041, $0.6334, and $0.644
Support levels: $0.5478, $0.5548, and $0.5601.
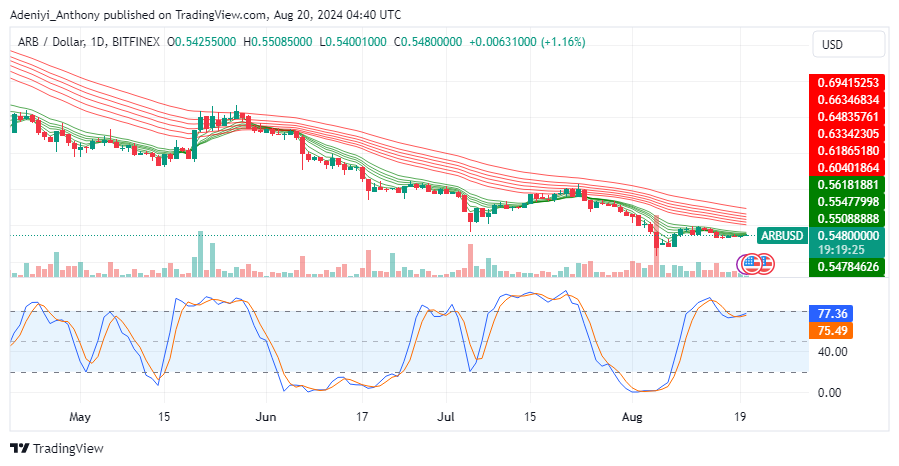
The chart suggests that Arbitrum has been on a downtrend since May, as evidenced by the downward sloping moving averages. However, the price is currently trading around $0.5480, a point slightly above the recent low. The recent green candles indicate some buying interest is building up and a reversal attempt is coming soon.
ARB/USD Price Prediction: Condition Reversal
The stochastic Relative Strength Index (SRSI) at the bottom of the chart displays ARB/USD operating in an overbought region, with the lines suggesting a bullish crossover. This could indicate that a rebound or correction to the upside might occur soon.
The overall condition of the market in this timeframe is bearish; more bullish strength is needed to break the closest resistance line. However, traders can aim at $0.5601.
Arbitrum Short-term Trend: Ranging (4H Chart)
The 4-hour chart is quite different from the daily chart, as the Arbitrum price line is seen enveloped by the Guppy Multiple Moving Averages (GMMA). This indicates a period of consolidation and indecisiveness among traders.
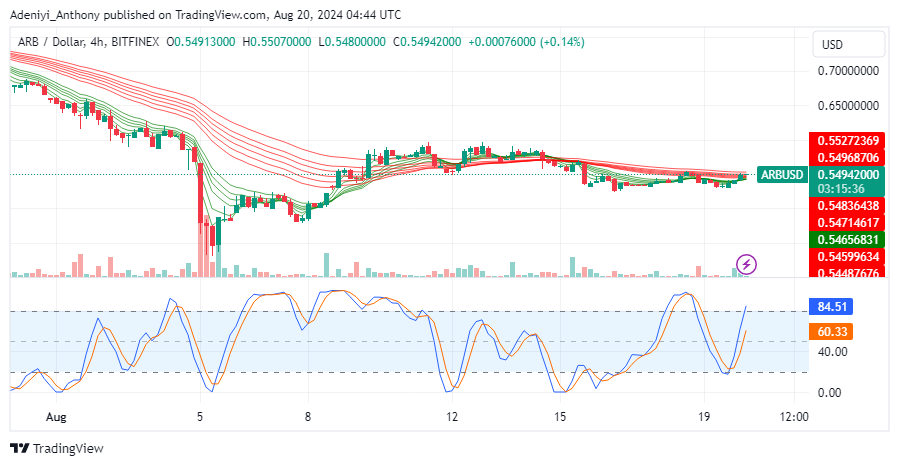
In other words, the SRSI at the bottom suggests the ARB/USD pair is operating in the overbought zone above 80%. This is an indication of upward momentum, but a pullback could occur if the overbought conditions persist.
In order to place winning trades with us via Bybit, you can open an account here.