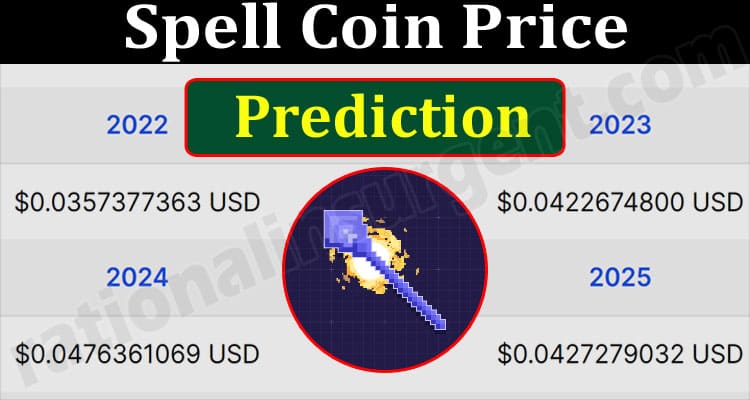
Quant Price Prediction: QNT/USD Displays Some Bullish Momentum
Estimated Reading Time: 2 minutes
Don’t invest unless you’re prepared to lose all the money you invest. This is a high-risk investment and you are unlikely to be protected if something goes wrong. Take 2 minutes to learn more

Quant Price Prediction – August 14.
The Quant price has been bearish for a considerable number of months in 2024 showing some series of higher lows and lower lows, a sign of contest between the bulls and the dominant bears as many of the traders’ activities are spotted under the Guppy Multiple Moving Averages (GMMA) lines.
QNT/USD Medium-term Trend: Bullish (Daily Chart)
Key Levels
Resistance Level: $68.11, $65.69, and $65.30
Support Level: $65.02, $64.91, and $64.88
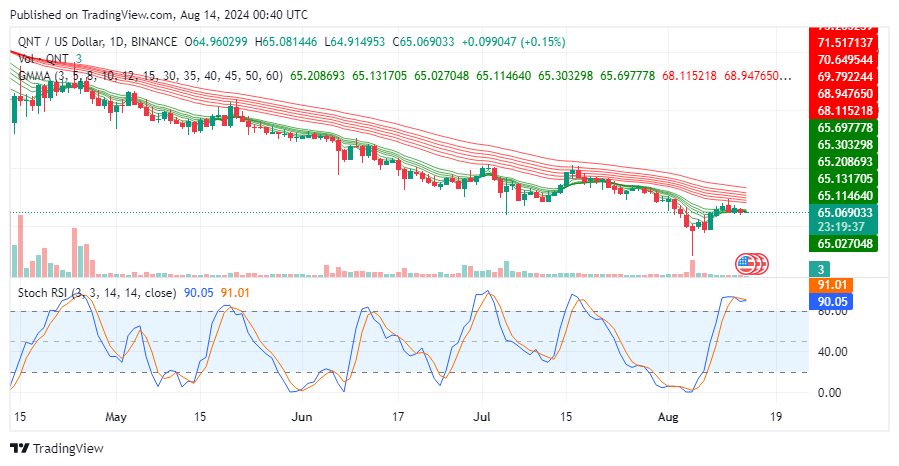
QNT/USD displays some bullish momentum under the cluster GMMA lines. The recent price action indicates that the price might be attempting to break out from the downtrend, but it is currently facing resistance around $65.30 and $68.11.
Quant Price Prediction: Condition For a Bullish Reversal
To achieve a trend reversal, the Quant’s price action will need to break through the moving averages acting as resistance of which more bullish strength is required. The price must break above these levels to confirm a trend reversal. Until then, the overall bias remains bearish. In addition, the stochastic Relative Strength Index (SRSI) suggests cautious trade as QNT is currently overbought and the price level might decrease before finding new support.
QNT/USD Medium-term Trend: Ranging (4H Chart)
In a shorter timeframe, the QNT prices take a different form. The price seems to be in a consolidation phase, suggesting the indecisiveness of traders, as the distinctive classes of moving averages are now wrapped around the price line. A break out above $65.24 or a break down below $64.88 would likely determine the next direction of the trend. However, the gap between the price and the GMMA lines signifies that the end of the consolidation phase is around the corner.
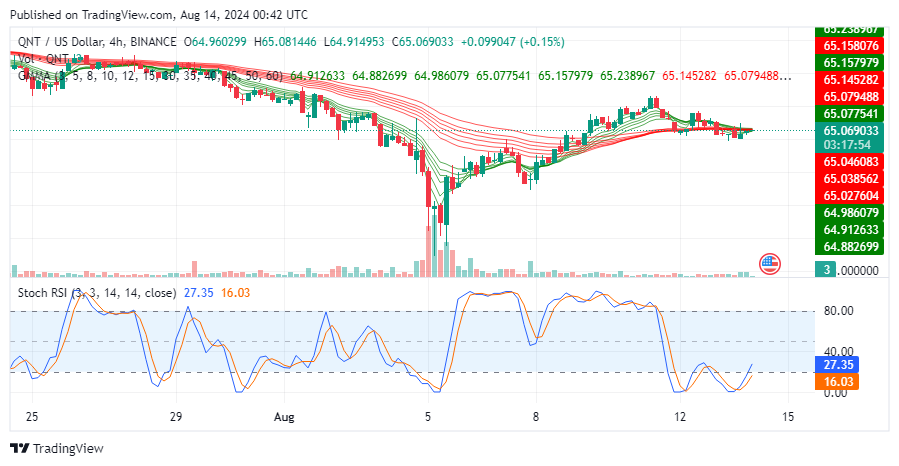
Also, the relative RSI suggests the coin is currently oversold for the time frame with the possibility that the price might proceed southwards before a complete reversal can be made. Short-time traders can still aim for gains towards the $70 mark.
In order to place winning trades with us via Bybit, you can open an account here