Litecoin (LTC) Price Prediction: LTC/USDT Trades Below the Year’s Opening
Estimated Reading Time: 2 minutes
Don’t invest unless you’re prepared to lose all the money you invest. This is a high-risk investment and you are unlikely to be protected if something goes wrong. Take 2 minutes to learn more

Date: January 13, 2026
The Litecoin market started the year on an upward path. However, this momentum has since faded, as price action pulled back toward lower levels and now presents a notably weakened outlook.
LTC/USDT Long-Term Trend — Bearish (Daily Chart)
Key Price Levels
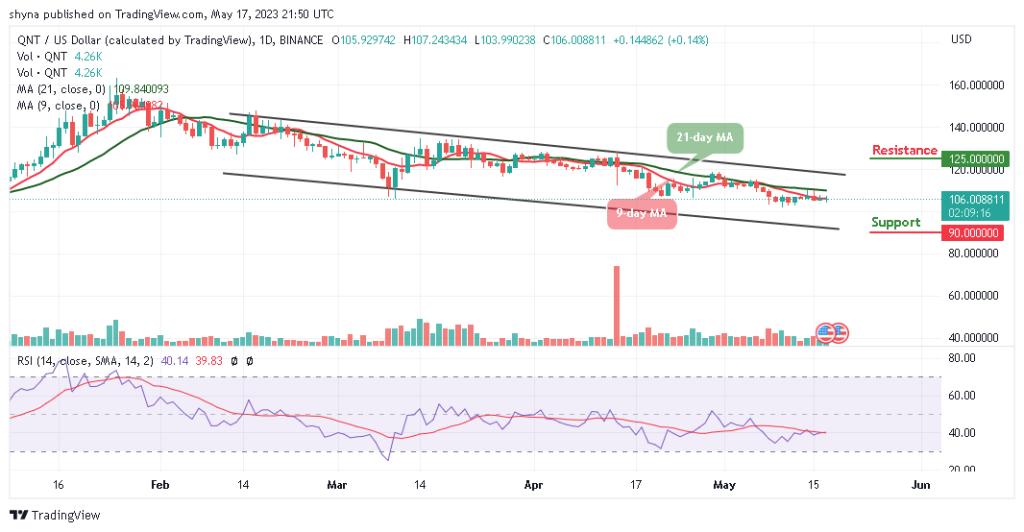
Resistance: $80, $85, $90
Support: $75, $70, $65

The current session on the Litecoin daily chart is bullish but remains below a key technical level. The latest price candle is green with a relatively small body and is positioned below the 9-day Exponential Moving Average (EMA). At the same time, the Stochastic Relative Strength Index (SRSI) lines continue to fall sharply into the oversold region. The terminal ends of the indicator are widely separated as they descend deeper into oversold territory.
Litecoin (LTC) Price Prediction: LTC/USDT May Register Further Dips
The LTC/USDT daily market suggests that bullish forces are attempting a comeback after bearish pressure erased all gains recorded since the start of the year. While the ongoing session is bullish, price action remains below the year’s opening level. In addition, trading below the 9-day EMA indicates that bearish headwinds are still present.
The SRSI indicator also suggests that downside pressure remains dominant and may continue to weigh on the market.
Litecoin (LTC) Price Prediction: LTC/USDT Bullish Attempt Looks Weak (4-Hour Chart)
On the 4-hour chart, the Litecoin market suggests that although limited bullish pressure is pushing against prevailing headwinds, momentum remains weak.

The latest price candle, as of the time of writing, appears larger than the previous one; however, price action continues to trade well below the 9-day EMA curve.
The SRSI indicator lines remain deep in the oversold region, but the terminal ends of the lines are beginning to turn upward following an upside crossover. Technically, this suggests the market may attempt a short-term recovery toward nearby targets around the $80 level.