Litecoin (LTC) Price Prediction: LTC/USDT Bullish Momentum Cools
Estimated Reading Time: 2 minutes
Don’t invest unless you’re prepared to lose all the money you invest. This is a high-risk investment and you are unlikely to be protected if something goes wrong. Take 2 minutes to learn more

Date: January 6, 2025
The Litecoin market has seen some moderate recovery in the upward direction over the recent past. However, lately the upside movement seems to be losing momentum, particularly in the ongoing session.
LTC/USDT Long-Term Trend — Bullish (Daily Chart)
Key Price Levels
Resistance: $85, $90, $95
Support: $80, $75, $70
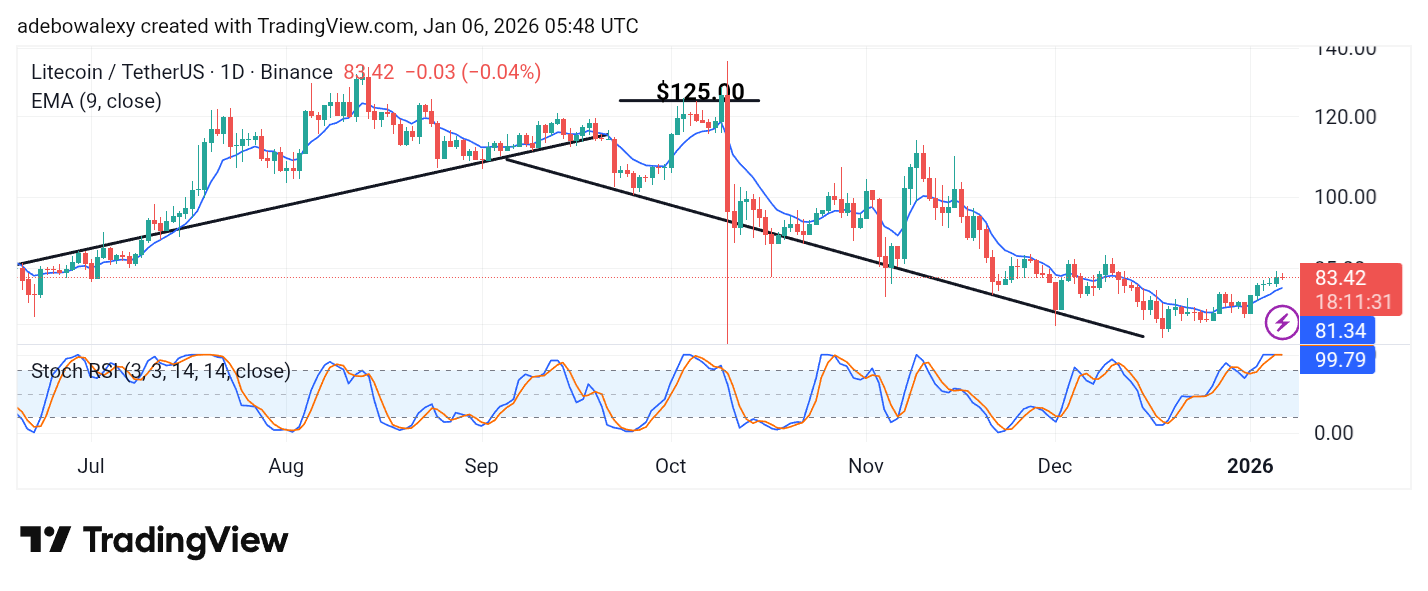
The Litecoin daily chart shows the Stochastic Relative Strength Index (SRSI) indicator lines already dragging sideways at the 100 level of the indicator. As a result, the corresponding price candle for the ongoing session has appeared red but keeps its base above the 9-day Exponential Moving Average (EMA) line.
Litecoin (LTC) Price Prediction: LTC/USDT Has a High Potential of Seeing a Pullback
Upside forces have been more prevalent lately in the Litecoin market. However, there are signs that suggest that upside forces may be having a tough time at the moment.
The last price candle on this chart is red but still stands above the 9-day Exponential Moving Average (EMA) line. Meanwhile, the SRSI indicator lines have reached roughly the 100 mark of the indicator and have also been dragging sideways around this level. Therefore, downward forces may prevail, and a retreat may occur from here.
Litecoin (LTC) Price Prediction: LTC/USDT Downward Rejection Looks More Evident (4-Hour Chart)
The Litecoin 4-hour market has granted more depth to the bearish retracement seen on the daily chart. Here, it can be observed that the ongoing session is represented by a red price candle. Despite this, it still stands above the 9-day EMA curve.
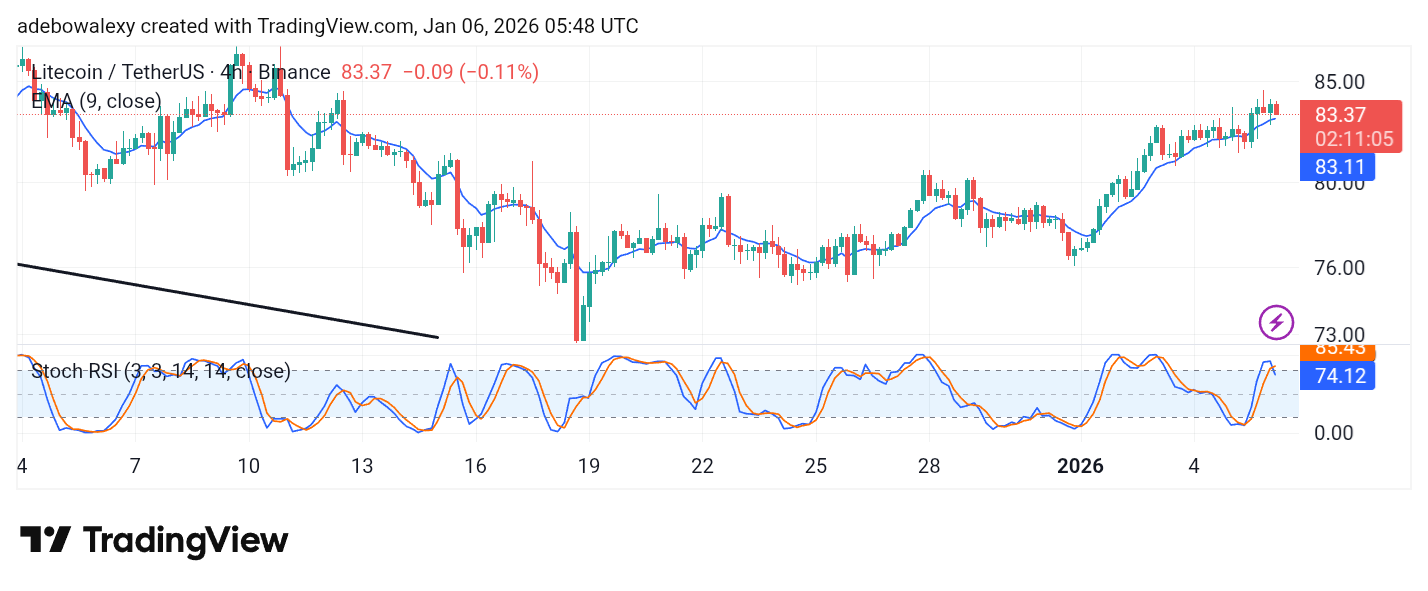
The downward rejection seen today has caused a downward crossover to be effected on the SRSI indicator. Consequently, it is clear that a pullback has occurred. However, should price action fall below the 9-day EMA, it may approach the $80 price level. On the other hand, if support at the 9-day EMA line holds, the market may push toward the $85 price level.