Cardano Is in a Tight Range as It May Slide Below $0.40 Low
Estimated Reading Time: 2 minutes
Don’t invest unless you’re prepared to lose all the money you invest. This is a high-risk investment and you are unlikely to be protected if something goes wrong. Take 2 minutes to learn more

Free Crypto Signals Channel
Cardano (ADA) Long-Term Analysis: Bearish
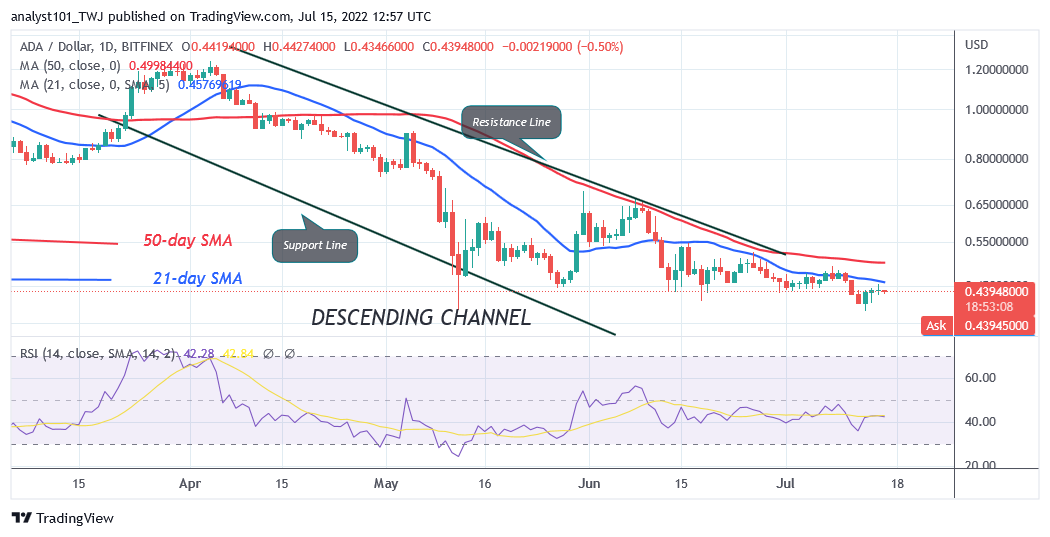
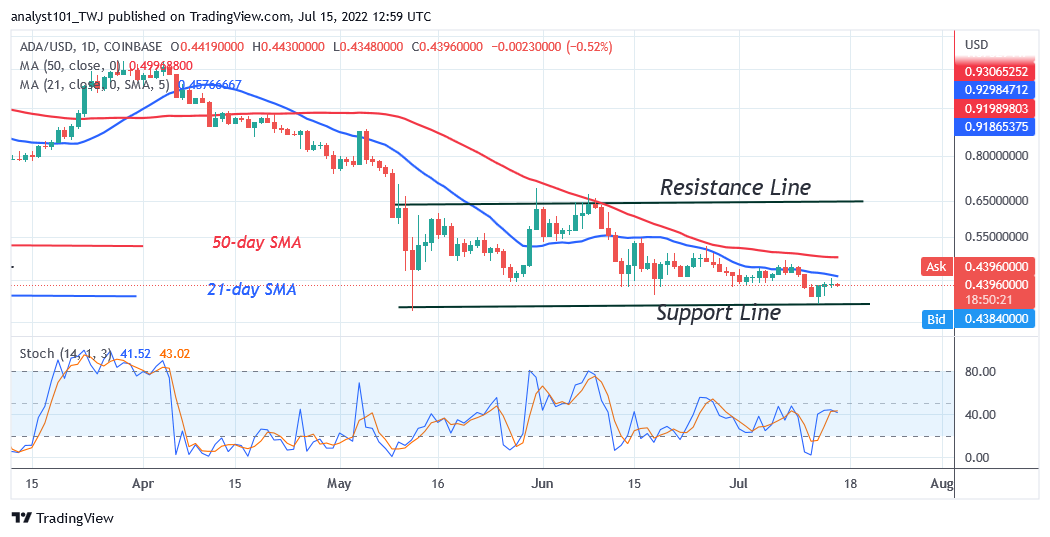
Cardano’s (ADA) price is in a downtrend as it may slide below $0.40 low. On July 13, the DOT price declined to the current support at $0.40 as bulls bought the dips. The cryptocurrency is rising to retest or break the 21-day line SMA. On the upside, if the bulls break above the 21-day line SMA, ADA price will rally above the 50-day line SMA or $0.55 high. Conversely, if Cardano faces rejection at the moving average, the altcoin will decline to the current support at $0.40. The downtrend will resume if the bears break below the current support. Perhaps, the coin will fluctuate between $0.40 and $0.46price levels if the current support holds.
Cardano (ADA) Indicator Analysis
Cardano is at level 42 of the Relative Strength Index for period 14. ADA is in the bearish zone and it may continue to decline. The altcoin’s price bars are below the moving average lines indicating a possible decline. It is above the 40% area of the daily stochastic. ADA price is in a bullish momentum.
Technical indicators:
Major supply zones: $2.0, $2.20, $2.40
Major demand zones: $1.40, $1.20, $1.00
What Is the Next Direction for Cardano (ADA)?
Since May 12, Cardano is in a sideways move as it may slide below the $0.40 low. The cryptocurrency has been fluctuating between $0.40 and $0.65 price levels. Since June 13, the altcoin has been trading between $0.40 and $0.46 price levels. The 21-day line SMA has restrained a further upward movement of the coin.
You can purchase crypto coins here. Buy LBlock
Note: Cryptosignals.org is not a financial advisor. Do your research before investing your funds in any financial asset or presented product or event. We are not responsible for your investing results