Lucky Block Price Prediction: LBLOCK/USD Trades Above $0.000026 Level
Estimated Reading Time: 2 minutes
Don’t invest unless you’re prepared to lose all the money you invest. This is a high-risk investment and you are unlikely to be protected if something goes wrong. Take 2 minutes to learn more
Lucky Block Price Prediction – November 5
The Lucky Block price prediction indicates a sideways movement, suggesting potential investor interest in the coin.
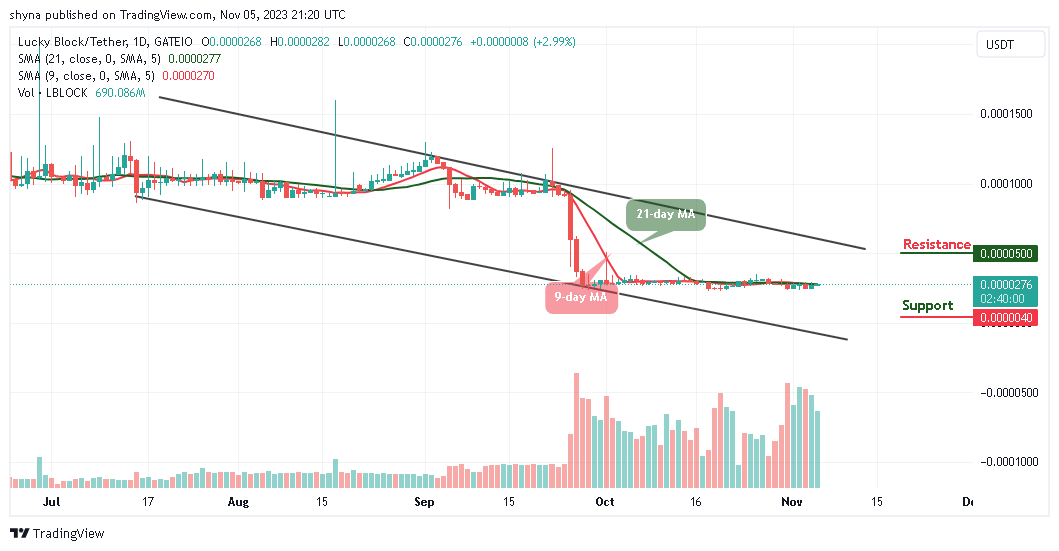
LBLOCK/USD Medium-term Trend: Bearish (1D Chart)
Key Levels:
Resistance levels: $0.000050, $0.000052, $0.000054
Support levels: $0.000004, $0.000003, $0.000002
LBLOCK/USD is poised to break above both the 9-day and 21-day moving averages, indicating a potential upward trend in market prices. Meanwhile, the bullish momentum is building up within this channel as the next target could be at the resistance level of $0.000030. However, if the price doesn’t make an upward move, it may maintain its sideways movement, presenting an opportunity for new investors to enter the market.
Lucky Block Price Prediction: LBLOCK/USD Would Make Upward Corrections
The Lucky Block price may rise and break above the 9-day moving average if the bulls put more pressure. Therefore, any further bullish movement above the 21-day moving average could push the price to the potential resistance levels of $0.000050, $0.000052, and $0.000054.
Meanwhile, any bearish movement below the lower boundary of the channel could hit the low of $0.000004, $0.000003, and $0.000002 support levels. Nevertheless, the 9-day moving average will cross above the 21-day moving average to confirm the bullish movement within the channel.
LBLOCK/USD Medium-term Trend: Ranging (4H Chart)
Looking at the 4-hour chart, the Lucky Block price is hovering above the 9-day and 21-day moving averages, this is likely to push the coin to the upside and any bullish movement will touch the resistance level of $0.000034 and above.
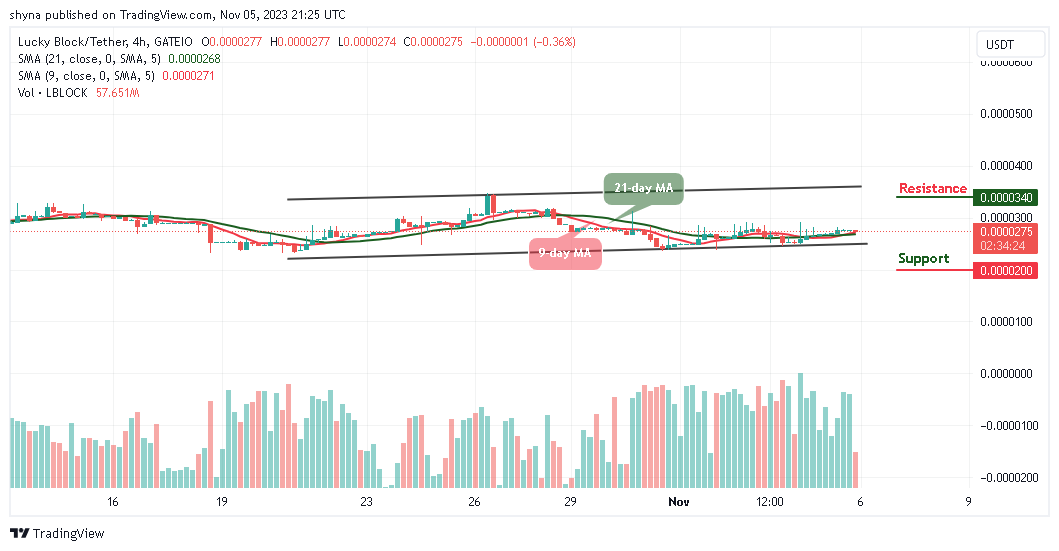
However, if the sellers bring the price below the lower boundary of the channel to bring back the coin into the bearish zone. The Lucky Block could become cheaper for new investors to enter the market as the nearest support level may be located at $0.000020 and below.
You can purchase Lucky Block here. Buy LBLOCK