Bitcoin (BTC/USD) Breaks Down at Lower Range-line
Estimated Reading Time: 3 minutes
Don’t invest unless you’re prepared to lose all the money you invest. This is a high-risk investment and you are unlikely to be protected if something goes wrong. Take 2 minutes to learn more
Bitcoin Price Prediction – June 9
The BTC/USD market operation that has been over a time, featuring between definite range-bound zones now breaks down at the lower range-line. The crypto’s valuation is currently traded around $32,750 at a minus rate of about 2.30 percent.
BTC/USD Market
Key Levels:
Resistance levels: $35,000, $40,000, $45,000
Support levels: $30,000, $25,000, $20,000
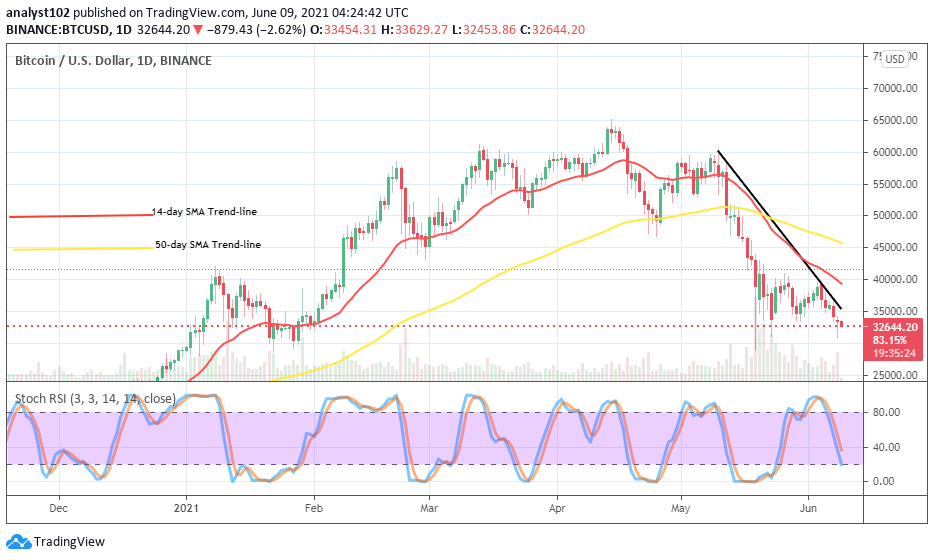
BTC/USD – Daily Chart
In the recent past operations, it was depicted that the levels of $40,000 and $35,000 are the definite range-bound trading zones kept by the crypto market. Currently, the lower range value has systematically breached southward to now give bearish outlook resumption on a gradual completion moving course. The bearish trend-line has drawn further downward to place at the immediate resistance of $35,000 as the 14-day SMA trend-line breaches the $40,000 resistance briefly to the south underneath the 50-day SMA indicator that is closely positioned a bit over the resistance level of $45,000. The Stochastic Oscillators have crossed the lines southbound pointing downward near range 20 to indicate ongoing selling pressure.
The BTC/USD present breakdown, how long will it go?
The presently experienced breakdown of the lower range-line at $35,000 appears to set the market operations between Bitcoin and the US Dollar on a bearish trend completion in the next session. That said, the immediate support level of $30,000 will most likely involve the furtherance or stoppage of the downward trading situation. A point around that market value, there is a tendency that price will witness an upward reversal in no time. Therefore, bulls are enjoined to be on the lookout while that assumption comes to play out.
As the lower range-line of the crypto-economy has breached downward, price stands the risk of getting lower further on a gradual moving note. The immediate support level may soon be visited in the near session. Holding of the market activities in an eventual consolidation moving style could in the long run pave a way in the extension of getting to see the lower value of the crypto-coin. Nevertheless, an emergence of a well-formed bullish candlestick from the dip, will mostly potentially be an end to seeing decent falling pressures
BTC/USD 4-hour Chart
Lately, there was a line of range-bound trading situations around the levels of $40,000 and $36,000 as depicted on the BTC/USD medium-term chart. On June 4, the crypto’s value was resisted at the upper range line. And, that has led to the breaking down of the lower range-line during June 7 trading operation. The 14-day SMA has slightly breached past the point of $36,000 as the bearish trend-line is closely drawn above it and, the 50-day SMA indicator is located over them. The Stochastic Oscillators have moved from the overbought region to seemingly attempt a crossing of the lines a bit above range 40. That could at a later portend a downward movement resumption to revisit a lower point around the level of $30,000.
Note: new.cryptosignals.org is not a financial advisor. Do your research before investing your funds in any financial asset or presented product or event. We are not responsible for your investing results.