ChainLink (LINK/USDT) Displays Strong Bullish Momentum Amid Overbought Condition
Estimated Reading Time: 3 minutes
Don’t invest unless you’re prepared to lose all the money you invest. This is a high-risk investment and you are unlikely to be protected if something goes wrong. Take 2 minutes to learn more

ChainLink Long-term Analysis: Bullish
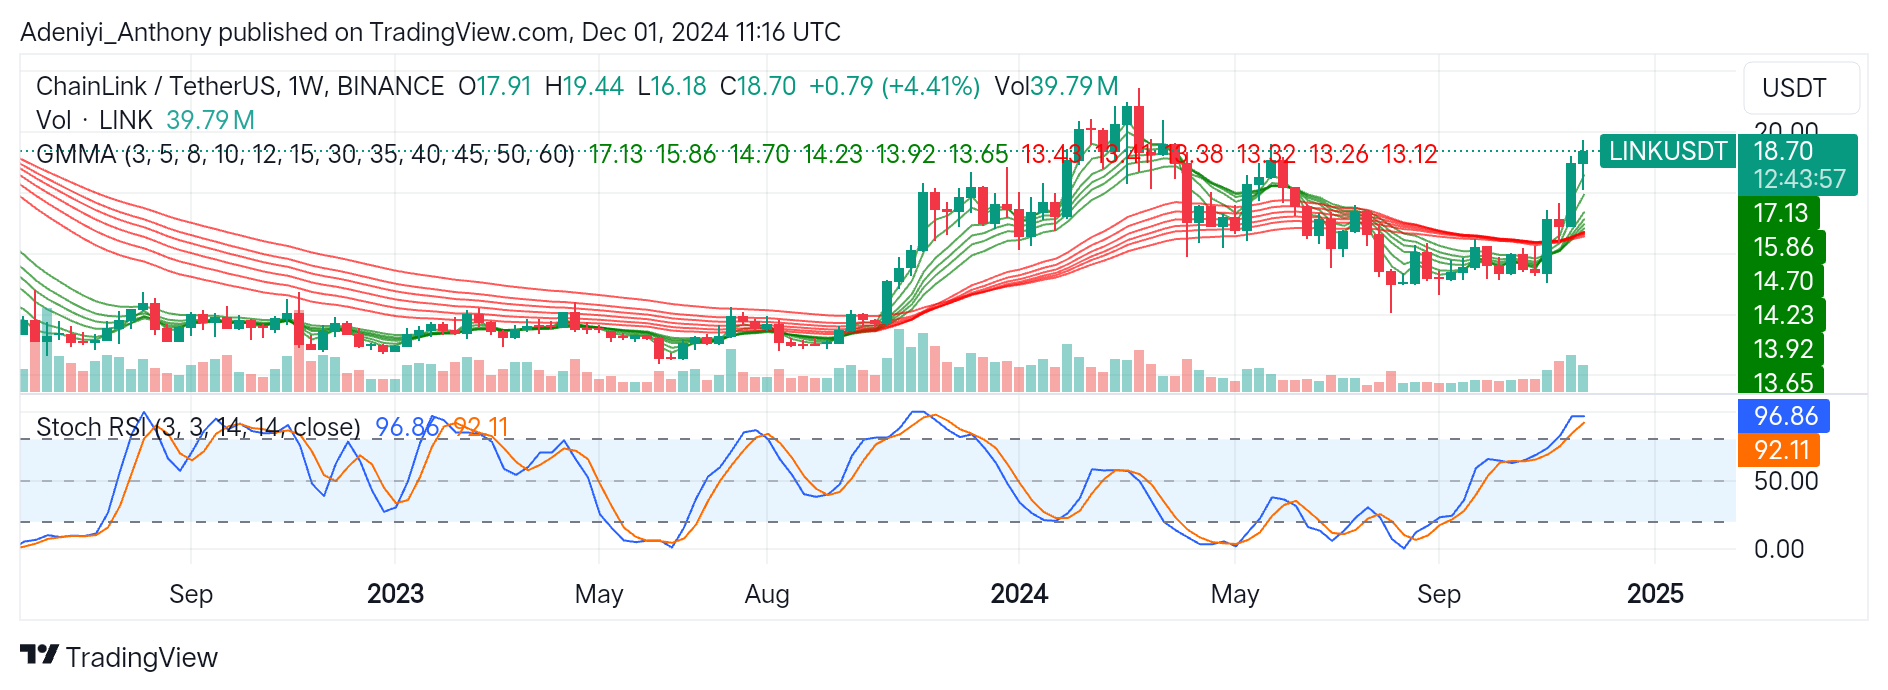
On the weekly chart, the overall market sentiment of ChainLink versus Tether shows significant positive momentum as the pair continues to breach resistance levels. The market has moved in a good direction recently, and a steady increase in volume indicates that investor confidence is rising. Though it cautions against possible short-term pullbacks, the Stochastic RSI indicates an overbought state, highlighting the strength of the bullish pressure.
Currently, ChainLink trades at $18.71 with 38.79 million traded volumes.
Technical Indicator
Major Resistance Levels: $19.44, $20.14, and $21.50
Major Support Levels: $15.86, $14.70, and $13.65
ChainLink Technical Analysis
The analysis of ChainLink against the Tether shows the pair is trending upward above the 60-period GMMA, with the recent convergence of the shorter EMAs and longer EMAs and rising trading volumes further reinforcing the bullish breakout.
Though the rising participation suggests the current price breakout is backed by genuine demand, the Stochastic oscillator shows the pair is in a critical zone with a potential short-term pullback in the near term.
To this end, a bullish breakout towards $19.10 would open the path to test $20.14 and other resistance levels. In contrast, a drop in trade volume would imply the possibility of a downturn. A drop below $18.00 would result in a retest of $15.86 or lower support levels.
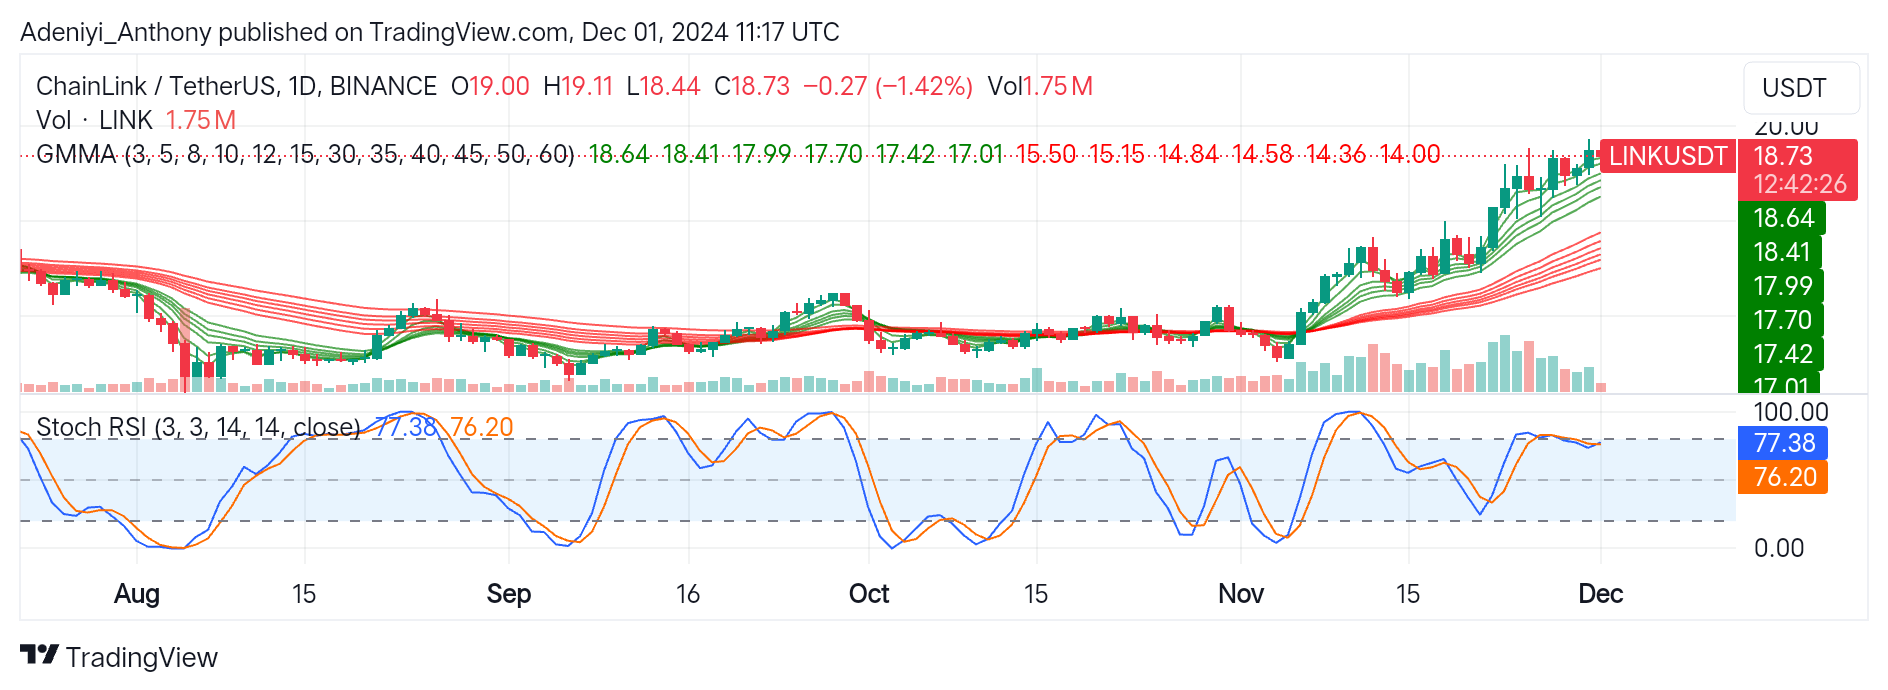
LINK/USDT Analysis: Is This a Minor Pullback or the Continuation of an Uptrend?
On a daily basis, LINK/USDT is seeing a minor decline, with the price falling by 1.42% to $18.73. Despite the minor dip, the price remains well above the upward-fanning GMMAs.
On the other hand, the Stochastic RSI signals a near-overbought condition while maintaining a positive bias.
To this end, LINK/USDT is still in a bullish pattern despite a modest daily decrease. If the price falls further, traders should keep an eye on the $18.00 and $17.70 levels as potential re-entry points. In contrast, diligent observation of changes in Stochastic RSI behaviour and a breakout over $19.45 would accelerate gains and define the next directional movement.
You can purchase crypto coins here. Buy LBlock