Wall Street Memes (WSM/USD) Price Bottoms, Making Bounces
Estimated Reading Time: 3 minutes
Don’t invest unless you’re prepared to lose all the money you invest. This is a high-risk investment and you are unlikely to be protected if something goes wrong. Take 2 minutes to learn more

Wall Street Memes Price Prediction – January 12
The price pathway that led to tangible pulling forces to the southward in the business dealings of Wall Street Memes coin against the trade worth of the US currency is bottoming, making bounces above the line of $0.0007.
The cryptocurrency market is now trading at about $0.00094264 between the lower and middle Bollinger Bands’ trend lines. As the base instrument tends to move downward around the indicators, it would be prudent to execute yearning position orders with the intention of letting the positions run in a long-term mode so that they may quickly play alongside any tenable, scared rebounds.
WSM/USD Market
Key Levels
Resistance levels: $0.0012, $0.0017, $0.0022
Support levels: $0.0007, $0.0005, $0.0003
WSM/USD – 4-hour Chart
The WSM/USD 4-hour chart showcases that the crypto-economic market is bottoming, making bounces above the value of $0.0007.
The Bollinger Bands’ trend lines have been positioned so they fall between the $0.0012 and $0.0007 horizontal lines. Additionally, the candlesticks’ use has been helping people make wise purchases in a certain reduced trade zone. The stochastic oscillators have currently veered north into the overbought area, indicating that the market is probably going to have a temporary halt before experiencing more upward pressures.
What is the current trading tempo of the WSM/USD market, which is now trading at roughly $0.0009?
The current trade outlook pattern that the WSM/USD market now keeps is that bears are tending to end moves while tending to go downward around the trend line of the lower Bollinger Band, given that the situation now shows that the price is bottoming, making bounces above the point of $0.0007.
Since the cryptocurrency market has been forced to shift valuation to significant depreciation zones, it is psychologically ideal for investors to start staking operations based on that sentiment. This is because, should the trend be able to establish stable positions, the subsequent price movements will turn significantly in order to break through variant resistances.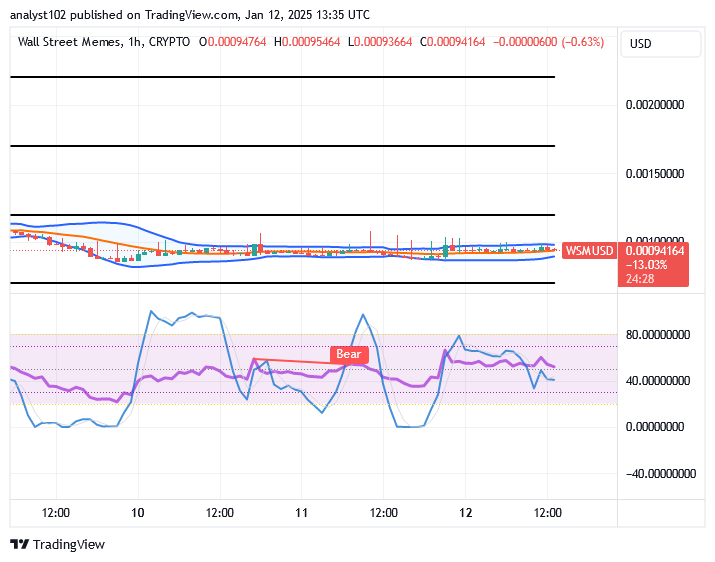
WSM/USD 1-hour chart
The 1-hour chart showcases the crypto-economy is bottoming, making bounces at a given lower end above $0.0007.
Candlestick formation has been observed in ranges where lower highs predominate over lower lows for the majority of signs. The Bollinger Bands’ trend lines have been extending eastward, indicating that the primary competing barrier location is about $0.001. The stochastic oscillators have been veering up and down through a range of values under a bearish signal configuration that is quickly losing its significance. Therefore, instead of thinking about selling off their points in a needless frenzy, purchasers should persist in carrying out yearning orders.
Buy and stake WSM now!: Wall Street Meme (WSM): https://wallstmemes.com/