Fantom (FTMUSD) Buyers Mount Pressure on the Supply Level
Estimated Reading Time: 2 minutes
Don’t invest unless you’re prepared to lose all the money you invest. This is a high-risk investment and you are unlikely to be protected if something goes wrong. Take 2 minutes to learn more
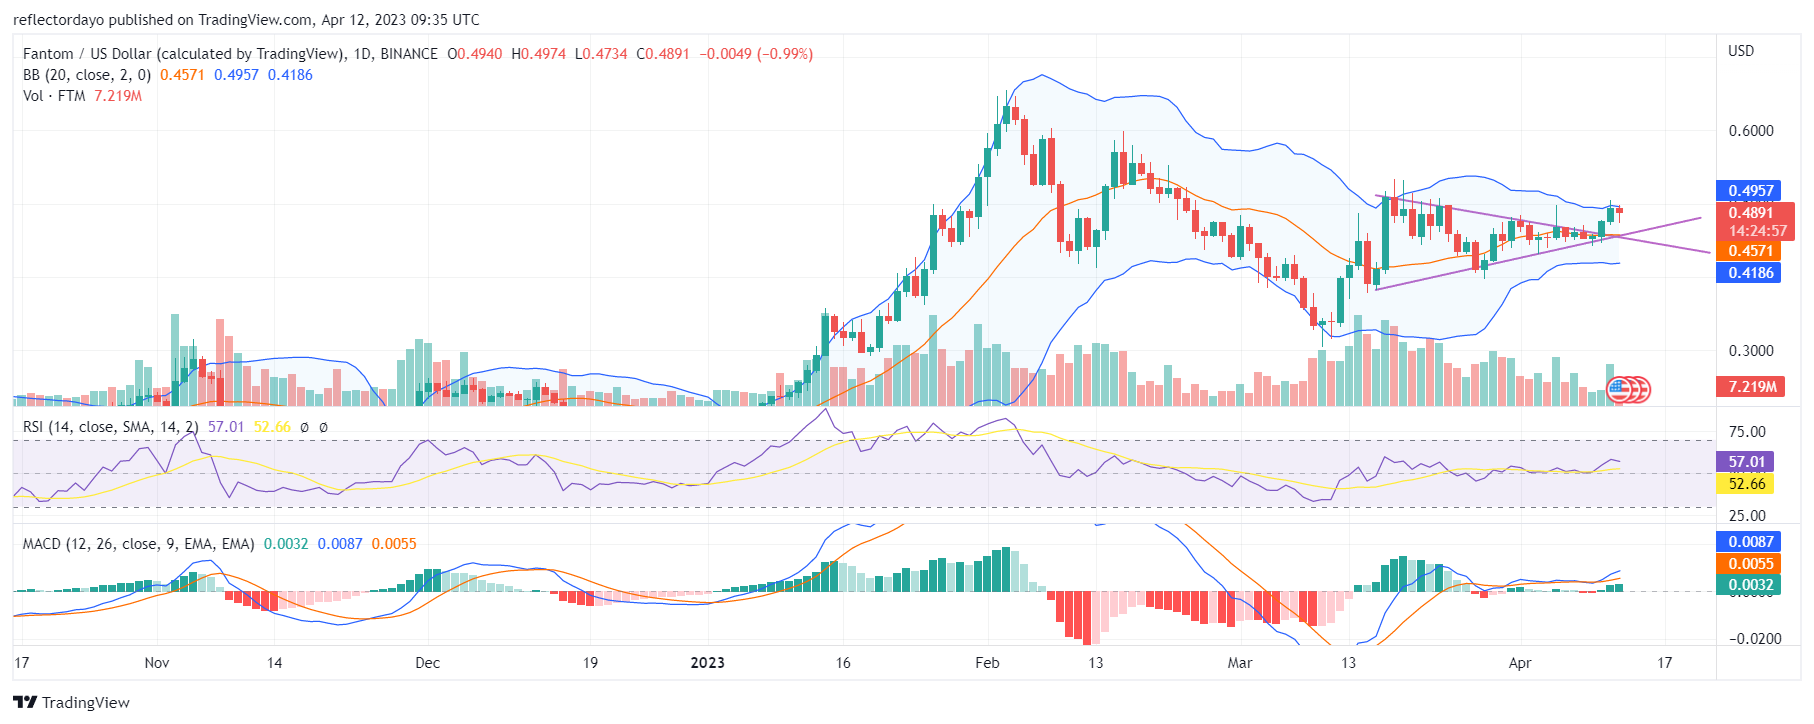
The Fantom market initially consolidates within the price channel of $0.3834 and $0.5079. Then, over the stretch of the remaining part of March up until this present day (in April), the proximity between the support and resistance has continued to grow as the market continues to range sideways around the $0.4636 price level, which is the equilibrium price.
FTM/USD Price Statistics
- FTM/USD Price Now: $0.496
- FTM/USD Market Cap: $1,364,219,427
- FTM/USD Circulating Supply: 2,784,940,287 FTM
- FTM/USD Total Supply: 3,175,000,000
- FTM/USD CoinMarketCap Ranking: #42
Key Levels
- Resistance: $0.6, $0.7, and $0.8
- Support: $0.4, $0.3, and $0.2.
Price Prediction for Fantom: The Indicators’ Point of View
Usually, when the price actions form a symmetrical candlestick pattern such as this one, it could have three possible results. This price formation may signify an imminent bullish price breakout, an imminent bearish price breakout, or the continuation of the price consolidation. In this case, it looks like a bullish price break as buyers are mounting pressure on the resistance level. However, according to the Bollinger Bands indicator, the activities of the buyers at the resistance level do not have a significant effect on the indicator, which still portrays a price consolidation trend.
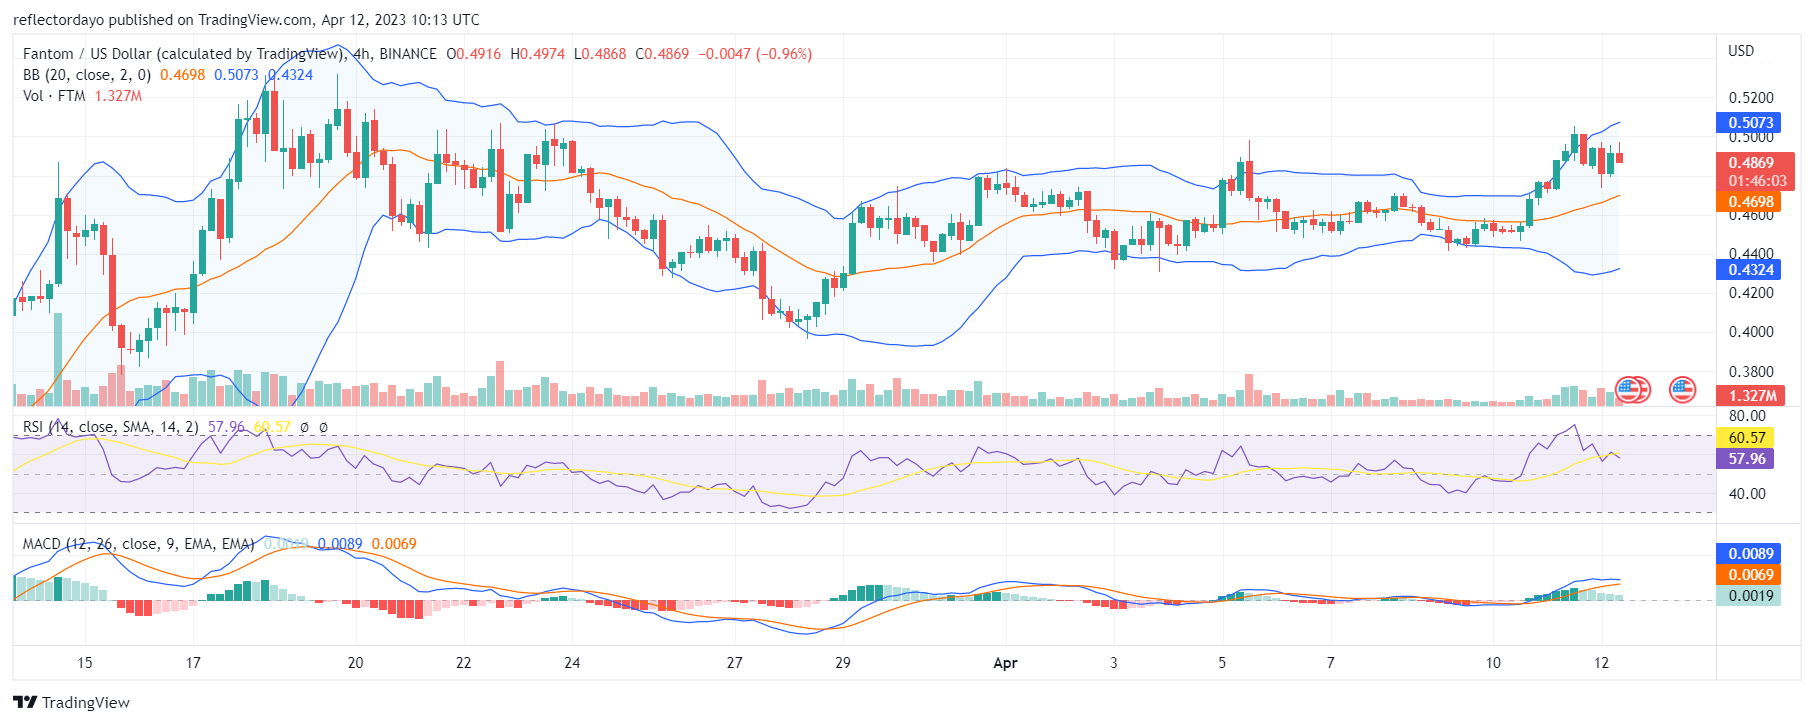
FTM/USD 4-Hour Chart Outlook:
From a 4-hour session standpoint, the Bollinger Bands indicator reflects the activities of the buyers toward breaking the resistance level. The indicator is now portraying the new up-trending price channel. We also noticed that after the bullish price was rejected at the $0.5 price level, the buyers were able to form a support level at $0.4789, which is near the resistance level. If the buyers can capture the resistance price, the uptrend will continue.