Bitcoin (BTC/USD) Market Holds Transactions in Ranges
Estimated Reading Time: 3 minutes
Don’t invest unless you’re prepared to lose all the money you invest. This is a high-risk investment and you are unlikely to be protected if something goes wrong. Take 2 minutes to learn more
Bitcoin Price Prediction – April 26
Some activities have been ongoing at higher-trading spots in the BTC/USD trade as the crypto market holds transactions around ranges characterized by the lines of $27,500 and $30,000 since the price has significantly sprung northward from the critical support of the $20,000 over time. Price is trading at $28,486.29, averagely maintaining a minute positive percentage rate of 0.38.
BTC/USD Market
Key Levels:
Resistance levels: $30,000, $31,000, $32,000
Support levels: $27,000, $26,000, $25,000
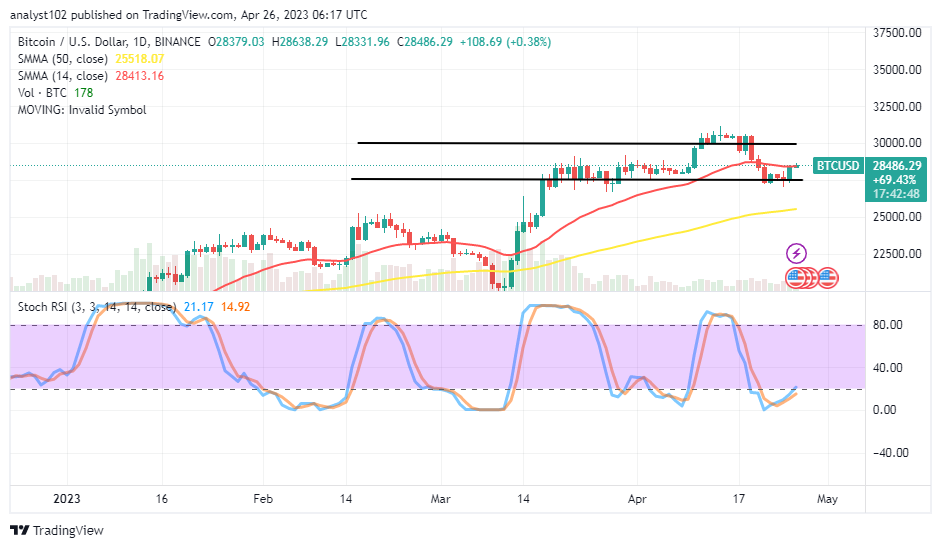
BTC/USD – Daily Chart
Today, on the BTC/USD daily chart, the crypto market holds transactions between $27,500 and $30,000 range-bound points. The 50-day SMA indicator is at a $25,518.07 value line beneath the $28,413.16 line of the 14-day SMA trading indicator. The Stochastic Oscillators have relatively crossed northbound from the oversold region to 14.92 and 21.17 levels. It means there will be more uprisings than downside decreases in the next moves against the US Dollar.
Is it technically okay to trade alongside a sudden breakdown of the $27,500 present baseline of the range points?
An aggressive reversal motion in the BTC/USD trade activities against the $27,500 psychological point will hardly produce some lows to approach support around the $25,000 as the crypto-economic market holds transactions around ranges predominantly marked by the values of $27,500 and $30,000. The situation currently has the backing of seeing reliable increases than decreases. However, long-position placers should make efforts while active motion is upward.
On the bearish trending path of the BTC/USD technical analysis record, it will take bears to engage in an intense consolidation-moving style if the range bottom of trading at $27,500 breaches fearfully southward afterward from the current trading spot to achieve lower lows subsequently. However, they should not keep longer than necessary.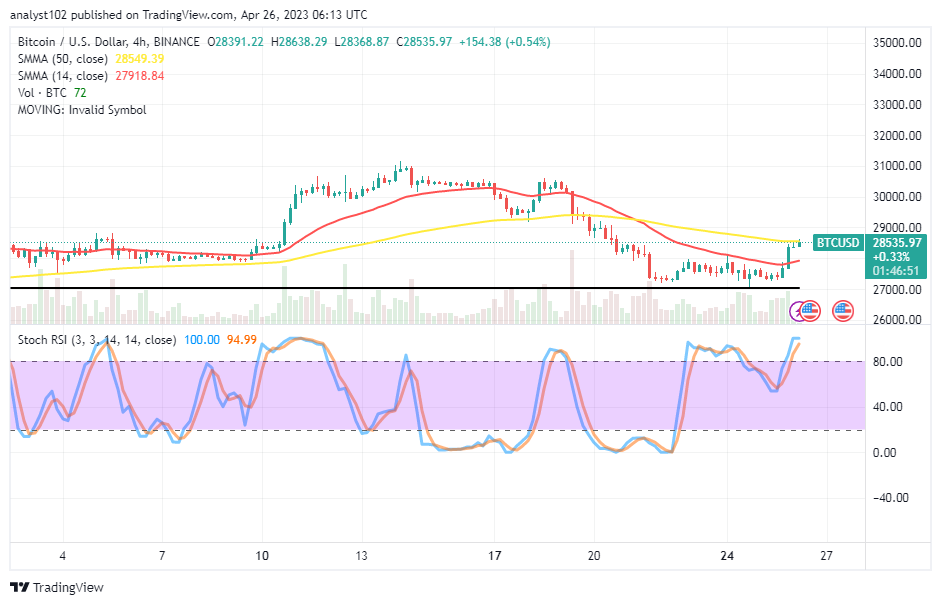
BTC/USD 4-hour Chart
The BTC/USD medium-term chart showcases the crypto market holds transactions in a recovery-moving mode against the US currency from a baseline of $27,000. The 14-day SMA indicator is $27,918.84 less than the 50-day SMA indicator’s value of $28,549.39. The Stochastic Oscillators have entered the overbought zone, and their readings of 94.99 and 100.00 suggest that a brief pause may be in order before deciding on the specific course of action.
Note: Cryptosignals.org is not a financial advisor. Do your research before investing your funds in any financial asset or presented product or event. We are not responsible for your investing results.
You can purchase Lucky Block here. Buy LBLOCK