Bitcoin (BTC/USD) Prices Oscillate Around $30,000
Estimated Reading Time: 3 minutes
Don’t invest unless you’re prepared to lose all the money you invest. This is a high-risk investment and you are unlikely to be protected if something goes wrong. Take 2 minutes to learn more
Bitcoin Price Prediction – April 19
Another session has been generated in the BTC/USD market activities as the crypto-economic prices oscillate around the $30,000 barrier-trading spot. It observed that the trading zones of today have been between the high of $30,510.65 and a low of $29,107.17, maintaining an average negative percentage rate of 3.78 as of the compiling of this technical piece. That sounds like a warning signal against getting further smooth running in the former trading instrument in the near time.
BTC/USD Market
Key Levels:
Resistance levels: $32,000, $34,000, $36,000
Support levels: $27,500, $26,500, $25,500
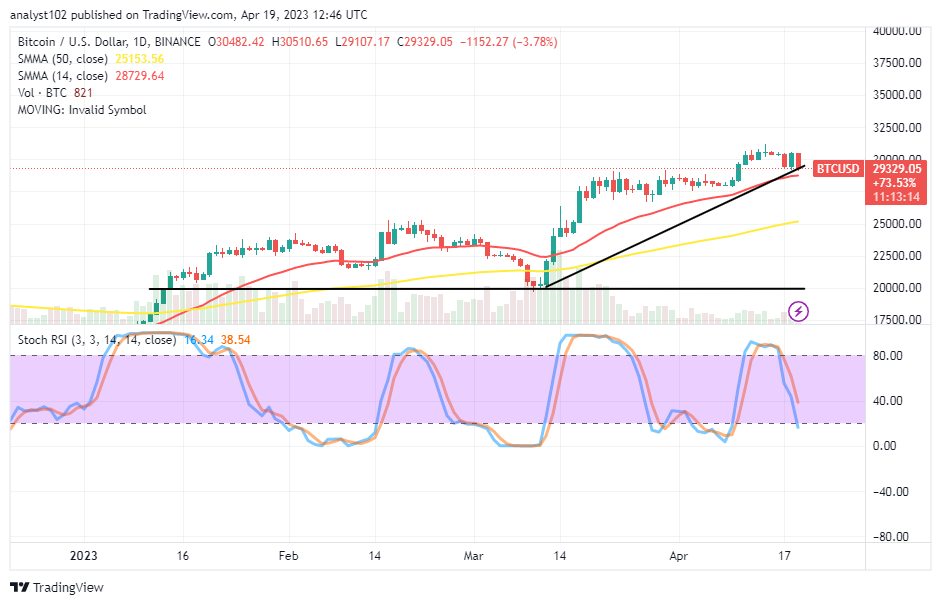
BTC/USD – Daily Chart
It is on the BTC/USD daily chart; the crypto-economic prices oscillate around the $30,000 high level of trading in the last several days ago. The 14-day SMA indicator is at $28,729.64 above the $25,153.56 value point of the 50-day SMA indicator. The Stochastic Oscillators have traversed southbound from the overbought region to the values of 38.54 and 16.34 to denote that a fall-off is in place. An aftermath situation of having a bearish-irreversible trading candlestick below the point in the headline will potentially mean that some lows will play out further in the succeeding rounds.
What is the BTC/USD market’s gravitational trading situation like at this level?
The trading capacity level of the BTC/USD trade has relatively fast exhausted in the direction of a declining motion as the crypto-economic prices oscillate around the 430,000 spots for quite a while. The Stochastic Oscillators’ position has demonstrated that if the cycle must proceed in that direction, less will emerge after trying to observe more devaluation processes in the long run.
On the downside of the technical analysis, selling activities may stay safer provided the resistances around $32,000 or $32,500 remain unbreachable against any aggressive outbreak that can occur in the crypto-economic valuation. That said, a consolidation-moving mode by the BTC/USD trade sellers around the point of the 14-day SMA will possibly allow a series of reducts to prevail.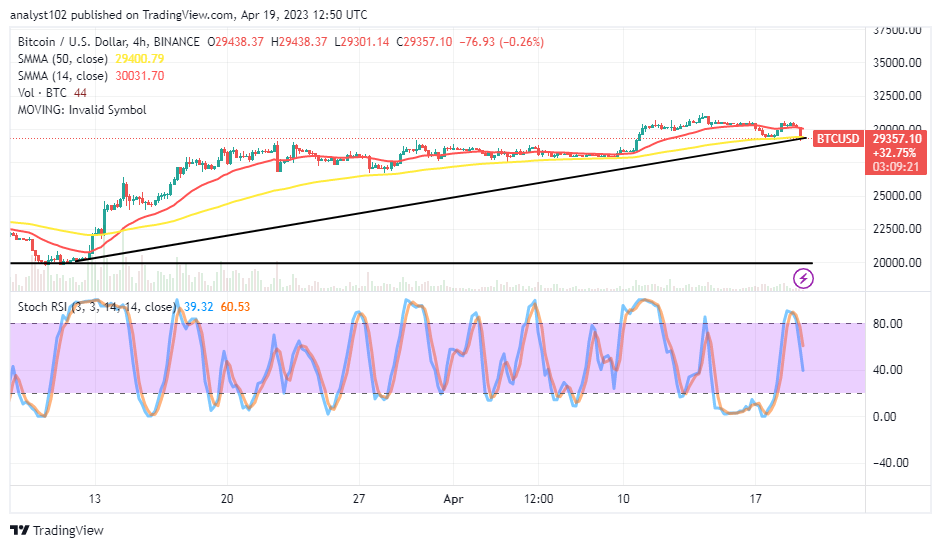
BTC/USD 4-hour Chart
The BTC/USD medium-term chart depicts that the crypto-economic prices oscillate around the $30,000 axis after a line of slight higher upsurges. Nearly above the 50-day SMA trend line is the 14-day SMA trend line. A bearish candlestick has slowly formed through the smaller indicator to touch the area of support of the bullish trend line to the bigger SMA. The Stochastic Oscillators have crossed southbound from around the 80 to 60.53 and 39.32 levels. The condition still portends the need for buyers to hold back for a while until the Stochastics reach lower values, portending a sign of a rebound afterward.
Note: Cryptosignals.org is not a financial advisor. Do your research before investing your funds in any financial asset or presented product or event. We are not responsible for your investing results.
You can purchase Lucky Block here. Buy LBLOCK