Bitcoin (BTC/USD) Market Has Risen to a $30,000 Resistance
Estimated Reading Time: 3 minutes
Don’t invest unless you’re prepared to lose all the money you invest. This is a high-risk investment and you are unlikely to be protected if something goes wrong. Take 2 minutes to learn more
Bitcoin Price Prediction – April 12
The trading happenings in the BTC/USD trade operation have eventually turned against the probable stance that could have allowed bears to gain control of the price to break down through the $27,500 has made the crypto market rise to a $30,000 resistance at the end. Buyers are pushing between the value lines of $29,837.94 and $30,704.06, as this technical article. There is a slight negative indication, indicating that it might be prudent to proceed with fresh longing orders cautiously at this time.
BTC/USD Market
Key Levels:
Resistance levels: $32,000, $34,000, $36,000
Support levels: $27,500, $26,500, $25,500
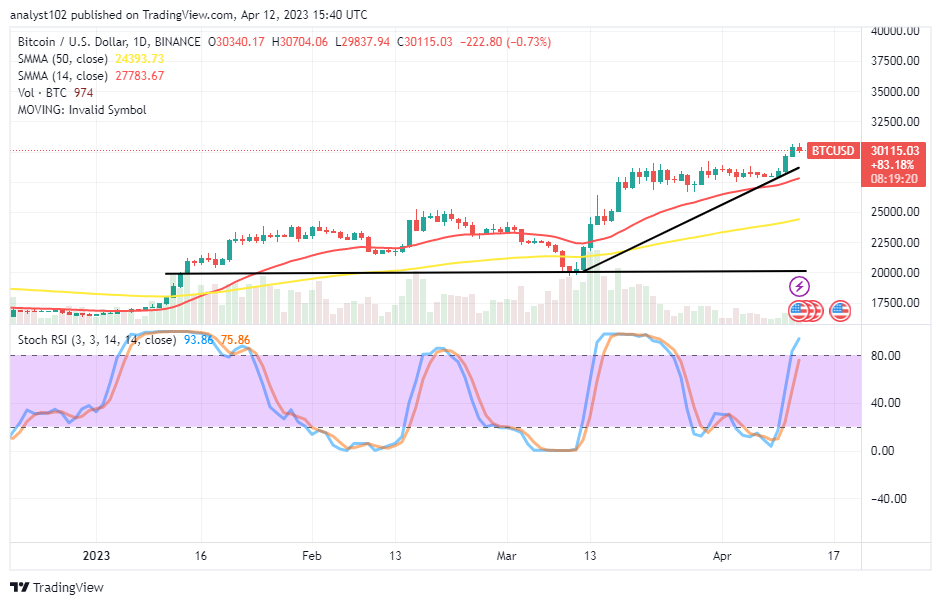
BTC/USD – Daily Chart
The BTC/USD daily chart reveals the crypto market has risen to a $30,000 resistance level above the SMA trend lines. The 14-day SMA indicator is at a $27,783.67 value line above the $24,393.73 line of the 50-day SMA indicator. The bullish trend line drew to mark the point where the recent uprising took off from. The Stochastic Oscillators have briefly penetrated the overbought region at 75.86 and 93.86 levels. That indicates that the next trading session will probably pause before the next firm moves.
Can there be a massive loss of momentum in the BTC/USD trade around the $30,000 resistance zone soon?
We may not expect to see a huge loss in the BTC/USD price quickly though it has shown that the crypto market has risen to a $30,000 resistance level. Right now, some good left-leaning impulses could likely cause the market’s valuation to climb into value irregularly during the next few days. So, it advised against taking long positions if the trade is entered quickly off the line described earlier.
On the downside of the technical analysis, sellers may resort to the correspondence reading stances between a 1-hour and a 4-hour chart in the overbought region to observe the time the BTC/USD price will likely fall to exert a sell order. And that assumption should also couple with the reading on the daily chart. But, over the long term, the immediate resistance level is expected to be $32,500.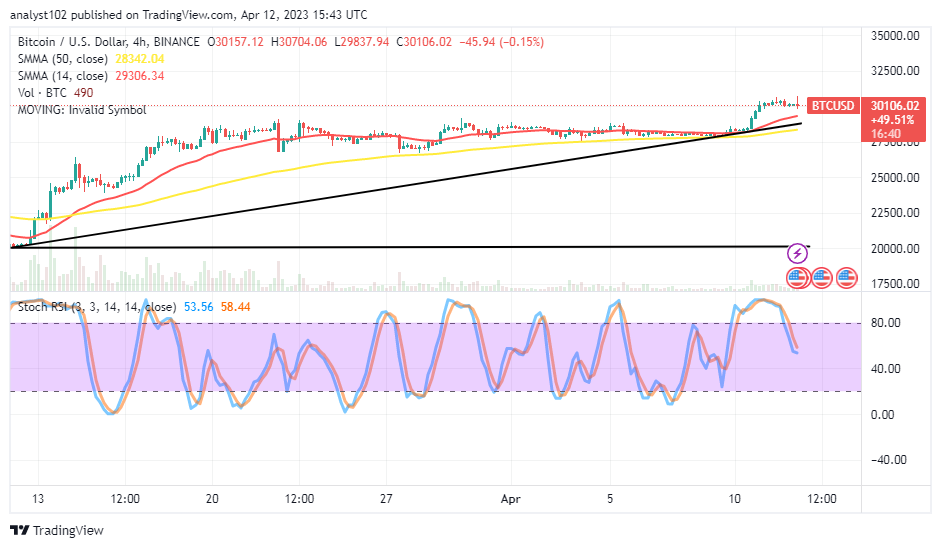
BTC/USD 4-hour Chart
The BTC/USD medium-term chart mirrors the crypto market has risen to a $30,000 resistance level. There have been shifts of indicators to the north side above the psychological $27,500 support trading zone as the 14-day SMA is at a $29,306.34 value point over the $28,342.04 of the 50-day SMA. 58.44 and 553.56 levels of the stochastic oscillators indicate that a reduction exercise is still largely ongoing. Nonetheless, the Oscillators’ stance in regions thought to be lower may ultimately lead to a continuation of the bullish run.
Note: Cryptosignals.org is not a financial advisor. Do your research before investing your funds in any financial asset or presented product or event. We are not responsible for your investing results.
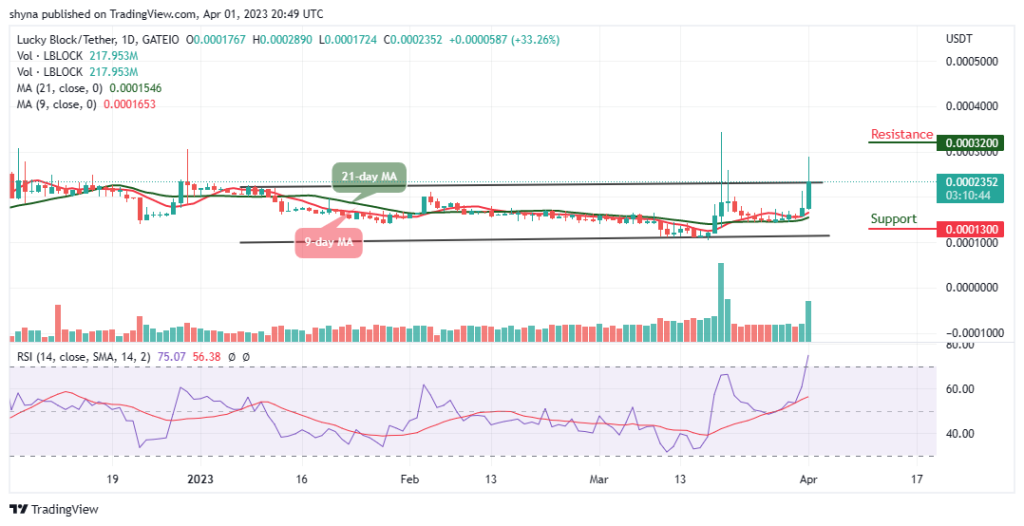
You can purchase Lucky Block here. Buy LBLOCK