Polkadot (DOT) Surges Ahead, Retest the $20 Resistance
Estimated Reading Time: 2 minutes
Don’t invest unless you’re prepared to lose all the money you invest. This is a high-risk investment and you are unlikely to be protected if something goes wrong. Take 2 minutes to learn more
Polkadot (DOT) Long-Term Analysis: Bearish
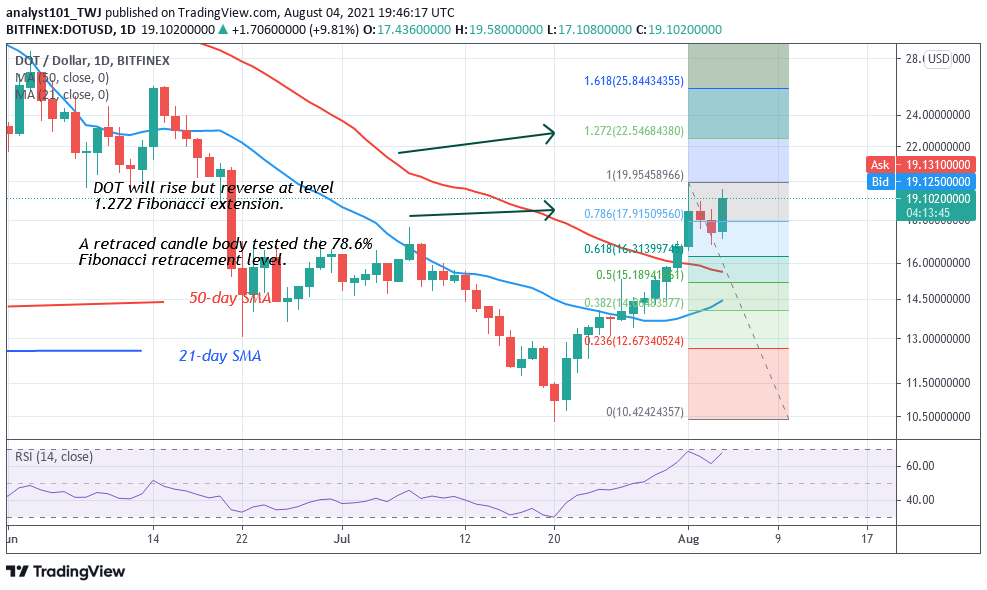
Polkadot’s (DOT) price has broken above the moving averages as price reached the bullish trend zone. In the first uptrend, the altcoin reached the $20 high but was resisted. The crypto retraced to $16.84 low and resumed a fresh uptrend. The coin is rising to retest and break the recent high. Meanwhile, on August 1 uptrend; a retraced candle body tested the 78.6% Fibonacci retracement level. The retracement indicates that DOT price will rise but reverse at level 1.272 Fibonacci extension or level $22.82. From the price action, Polkadot is rising to break the resistance at $20. A break above the $20 resistance will catapult the crypto to rally above $22.
Polkadot (DOT) Indicator Analysis
Polkadot is at level 68 of the Relative Strength Index period 14. It indicates that the crypto is almost in the overbought region. DOT/USD has no enough room to rally on the upside. DOT price is above the 80% range of the daily stochastic. The daily stochastic also indicate the overbought condition of the coin. The 21-day and 50-day SMAs are sloping northward indicating the uptrend.
Technical indicators:
Major Resistance Levels – $48, $52, $56
Major Support Levels – $32, $28, $24
What Is the Next Direction for Polkadot (DOT)?
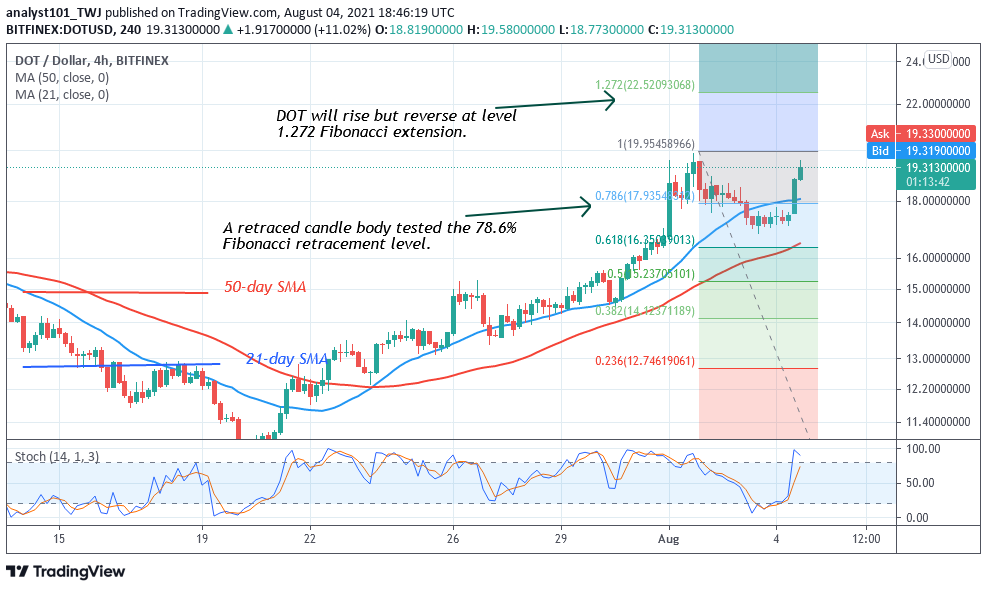
Polkadot is rising in the bullish trend zone. On the 4-hour chart, the crypto is in an uptrend zone. The $20 resistance is being retested the second time. Meanwhile, on August 1 uptrend; a retraced candle body tested the 78.6% Fibonacci retracement level. The retracement indicates that the DOT price will rise but reverse at level 1.272 Fibonacci extension or level $22.52.
You can purchase crypto coins here. Buy Tokens
Note: Cryptosignals.org is not a financial advisor. Do your research before investing your funds in any financial asset or presented product or event. We are not responsible for your investing results