Is Lucky Block (LBLOCK) Primed for a Bullish Breakout?
Estimated Reading Time: 3 minutes
Don’t invest unless you’re prepared to lose all the money you invest. This is a high-risk investment and you are unlikely to be protected if something goes wrong. Take 2 minutes to learn more

Lucky Block (LBLOCK) has demonstrated potential for a positive price movement, with key indicators showing signs of upward momentum. The recent price action reflects a balanced struggle between the bulls and bears, setting the stage for possible bullish trends. Below is a detailed analysis based on the daily and 4-hour charts.
Daily Chart Analysis of Lucky Block
On the daily chart, LBLOCK is currently trading at approximately $0.00001833. The Bollinger Bands are widening, indicating increasing volatility. The price is hovering close to the upper band at $0.00002054, suggesting a possible breakout to the upside if momentum continues.
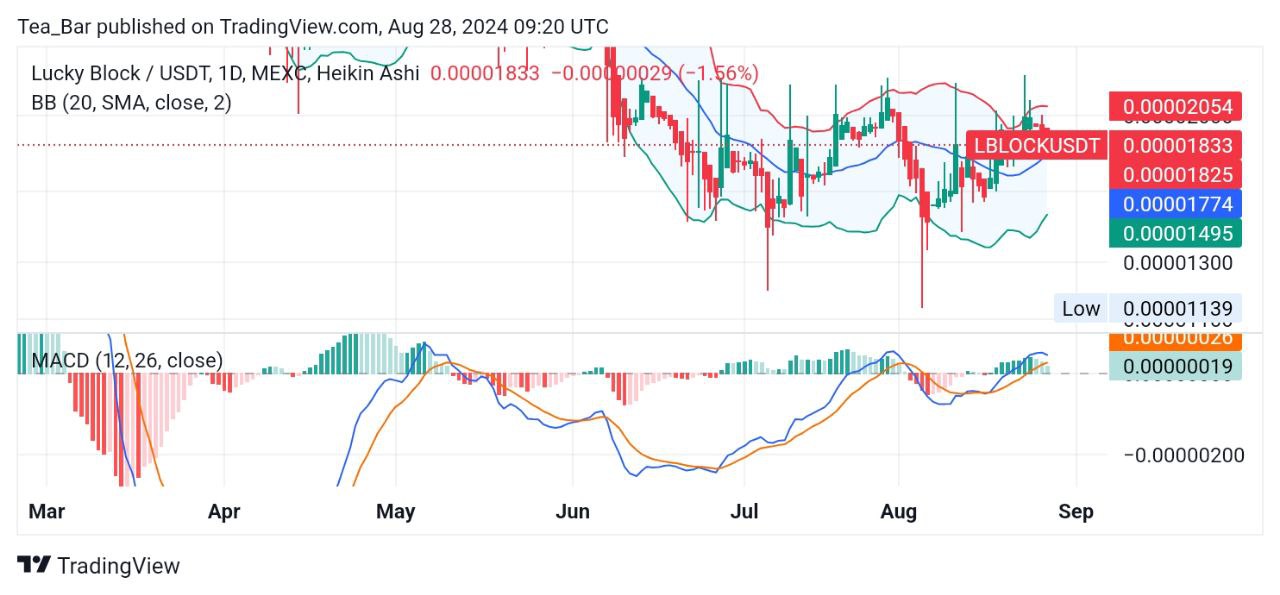
The Moving Average Convergence Divergence (MACD) indicator shows a bullish crossover, with the MACD line above the signal line. This positive signal suggests that buying pressure is increasing, which could propel the price further upwards.
The support levels are at $0.00001774 and $0.00001495, while the resistance levels stand at $0.00001825 and $0.00002054. Breaking through the resistance at $0.00002054 could see the price testing higher levels, potentially reaching $0.00002100.
4-Hour Chart Analysis
The 4-hour chart confirms the bullish outlook. LBLOCK is trading at $0.00001825, with the Bollinger Bands contracting slightly, indicating a period of consolidation before the next move. The price is currently near the middle band, suggesting a balanced market sentiment.
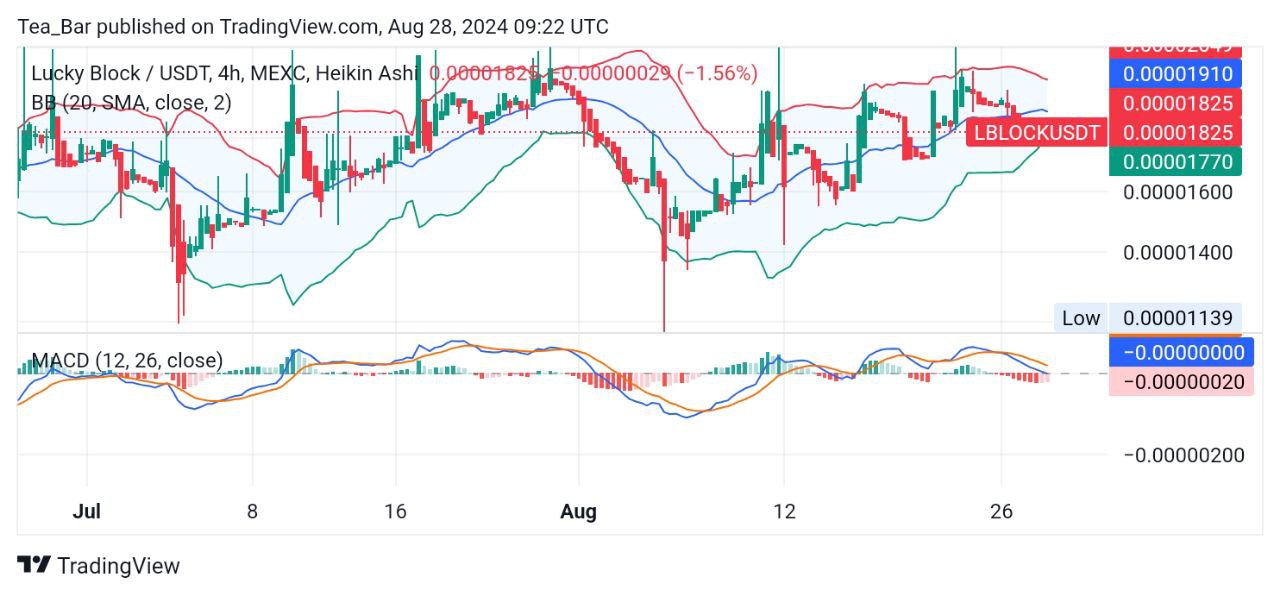
The MACD on the 4-hour chart is also bullish, with the MACD line crossing above the signal line. This crossover supports the potential for a short-term upward move, especially if the price can maintain its position above $0.00001825.
Support is found at $0.00001770, while resistance is at $0.00001910. A break above $0.00001910 could lead to a retest of the $0.00002000 psychological level, which, if broken, could see the price aiming for higher targets.
Conclusion
Overall, LBLOCK shows promising signs of a bullish trend in both daily and 4-hour timeframes. The MACD and Bollinger Bands support a potential upward movement, especially if the price can break through key resistance levels. Traders should watch for a sustained move above $0.00002054 on the daily chart and $0.00001910 on the 4-hour chart for confirmation of a bullish trend continuation.
You can purchase Lucky Block here. Buy LBLOCK.