Bearish Gravity Weighs Strongly on the Band Protocol (BANDUSD) Market
Estimated Reading Time: 2 minutes
Don’t invest unless you’re prepared to lose all the money you invest. This is a high-risk investment and you are unlikely to be protected if something goes wrong. Take 2 minutes to learn more
BANDUSD Analysis – The market is weighed down by bearish gravity
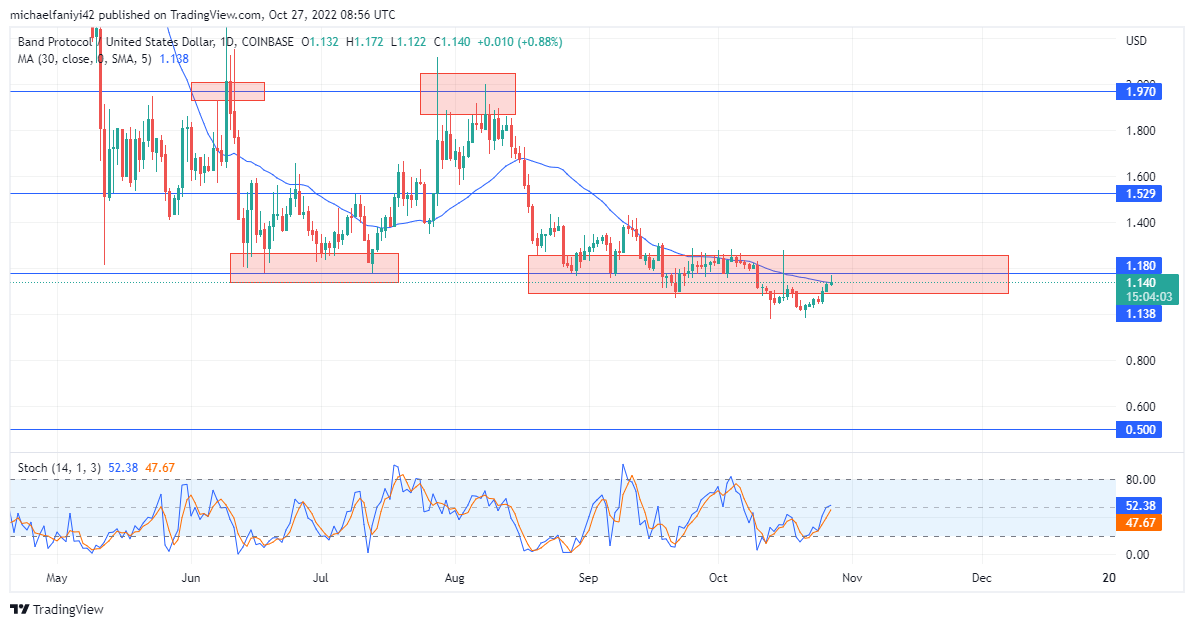
Bearish gravity weighs strongly on the BANDUSD market, which is causing the price to gradually drop out of the $1.180 zone of influence. It has been a real struggle against bearish gravity since the middle of the year. The $1.970 resistance level has been very instrumental for the sellers to prevent any movement of the price higher whatsoever.
BANDUSD Key Levels
Resistance Levels: $1.180, $1.970
Support Levels: $0.500, $0.005
Since dropping to the $1.180 support level on the 12th of May, the coin has been unable to lift itself past the resistance level at $1.970. The price rose against the tide to test the resistance on a couple of occasions, but when it failed, the coin was then seen bordering the $1.180 support level. The bearish gravity has seen the market gradually slip through the support level with consistent lower lows.
Right now, the price has just broken out of the zone of influence. With this, the coin is expected to keep sliding down more. The MA period 30 (Moving Average) is hovering above the daily candlesticks and offering itself as an extra layer of resistance to the uptrend. The Stochastic Oscillator lines, which have been undulating wildly, have now been limited to the bearish half of their last two cycles.
Market Expectation
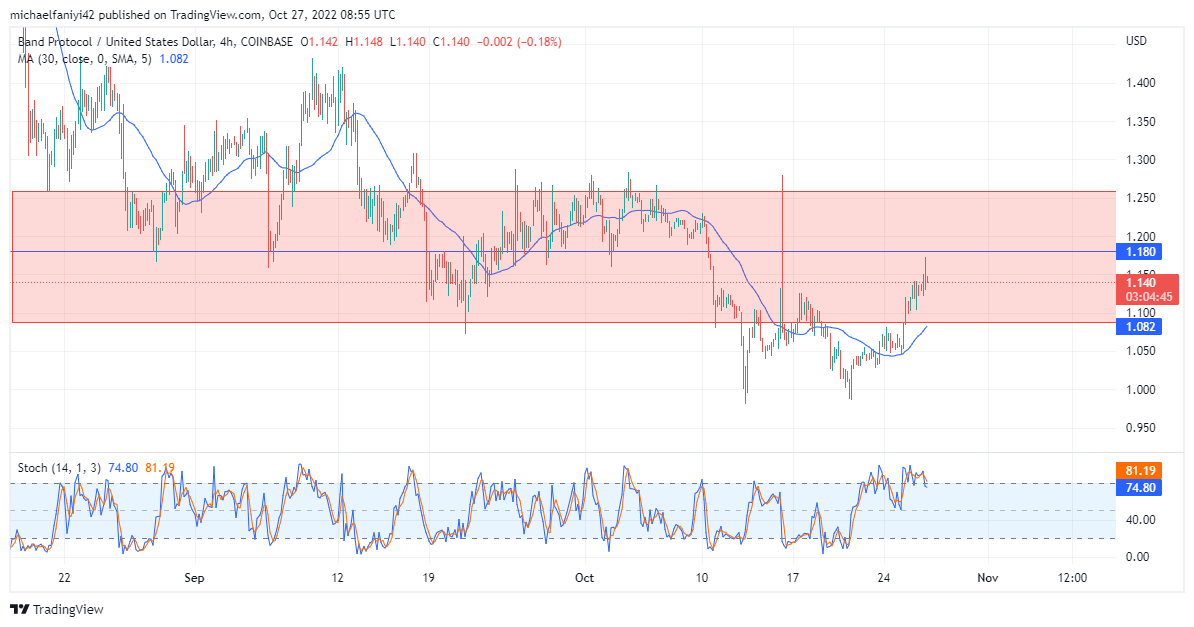
Currently, the latest candlesticks in the market have surged back toward the $1.180 key level. In doing so, the price has traded slightly above the MA period 30. The Stochastic Oscillator lines have bounced upward from a double bottom pattern and are about to cross the middle line of the chart. If the market can climb back above the $1.180 resistance, then it will work on pushing against the tide to test $1.970.
You can purchase Lucky Block here. Buy LBLOCK
Note: Cryptosignals.org is not a financial advisor. Do your research before investing your funds in any financial asset or presented product or event. We are not responsible for your investing results.