Cosmos (ATOM/USD) Begins Another Trading Cycle
Estimated Reading Time: 2 minutes
Don’t invest unless you’re prepared to lose all the money you invest. This is a high-risk investment and you are unlikely to be protected if something goes wrong. Take 2 minutes to learn more
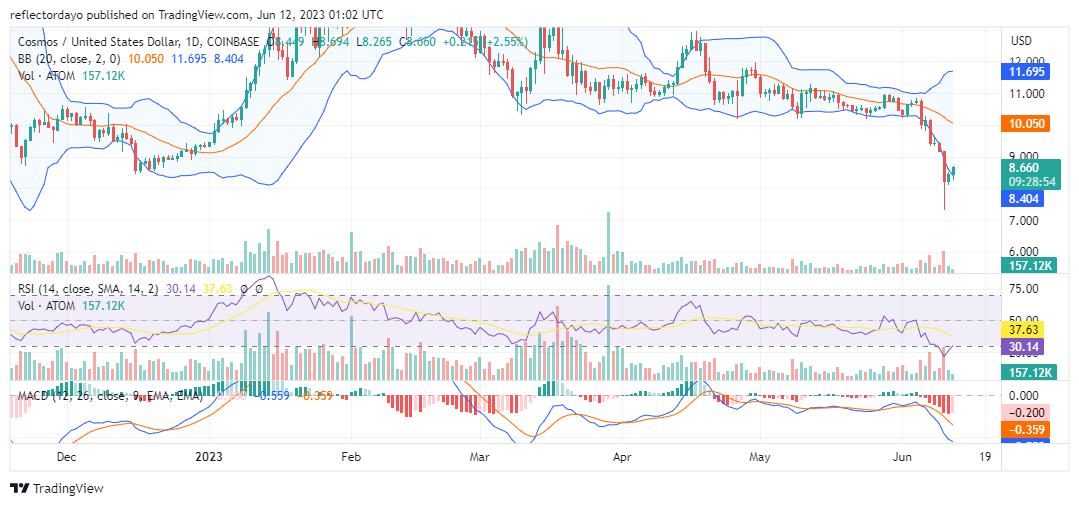
The market began to trend along a horizontal channel around the $10.9 price level between May 10 and June 4, before it saw a massive downturn. Between June 5 and June 10, strong liquidity in the Cosmos bear market made it reach its year-low of $7.38. The bearish storm caused the market to go beyond January 1’s $9.3 price level.
Cosmos Market Data
- ATOM/USD Price Now: $8.7
- ATOM/USD Market Cap: $3,000,188,051
- ATOM/USD Circulating Supply: 346,608,690 ATOM
- ATOM/USD CoinMarketCap Ranking: #20
Key Levels
- Resistance: $11.00, $11.50, and $12.00
- Support: $8.00, $7.50, and $7.30.
Price Prediction for Cosmos (ATOM): The Indicators’ Point of View
Currently, the market is recovering from below the $9.3 price level. This same level, which was the starting point of the Cosmos market cycle on January 1, has now become a barrier that the recovering market will have to face. From the standpoint of the Relative Strength Index (RSI), bulls are aggressively taking advantage of the price dip, but according to the trading volume indicator, the general trading activity for today is low. Nevertheless, the market is facing an upside direction, but with a low volume of trade, the price movement will be slow.
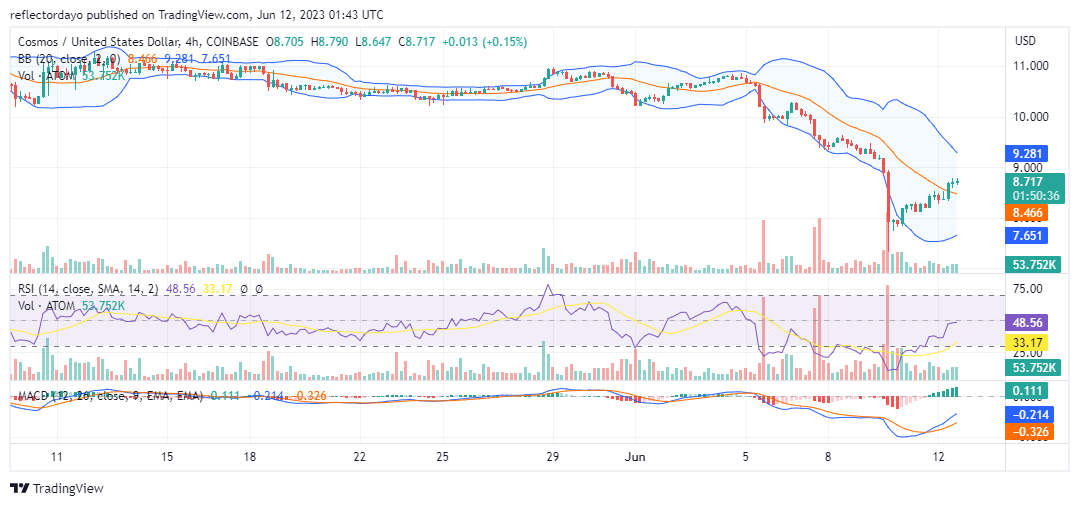
The Cosmos (ATOM) Market 4-Hour Chart Outlook:
Because of the low liquidity in the market, bulls need to face the barrier of the $8.7 resistance price level. Although, from the 4-hour timeframe, the recovery has taken the market above the 20-day moving average, and the lower standard deviation along with the moving average are responding positively to this new development in the market, the $8.7 price barrier may either result in a price consolidation trend or further bearish progress into the demand zone.