Bitcoin Cash (BCH/USD) Market Returns to a Correction Process
Estimated Reading Time: 3 minutes
Don’t invest unless you’re prepared to lose all the money you invest. This is a high-risk investment and you are unlikely to be protected if something goes wrong. Take 2 minutes to learn more

Free Crypto Signals Channel
Bitcoin Cash Price Prediction – April 8
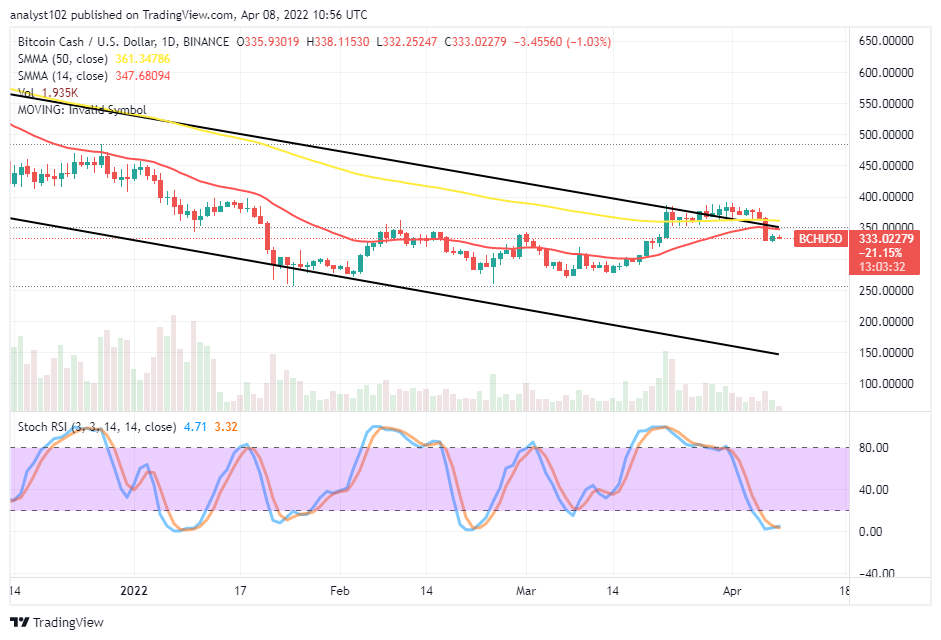
The BCH/USD market currently returns to a correction process when it couldn’t surge past the $400 resistance line. The crypto-economic trade is between the high and the low-value lines of $338 and $332 as it keeps a negative percentage of 1.03.
BCH/USD Market
Key Levels:
Resistance levels: $400, $450, $500
Support levels: $300, $250, $200
BCH/USD – Daily Chart
The BCH/USD daily chart shows the crypto-economic market returns to a correction process as a bearish candlestick emerged during the April 4th operations to clarify the direction to the downside. The 14-day SMA indicator has moved northward closer to the 50-day SMA indicator from beneath. And a set of candlesticks is now formed closely underneath the SMAs. The Stochastic Oscillators have moved southbound into the oversold region. And they have closed their lines near around the zero range value.
Will the BCH/USD trade activities lose value as the market returns to a correction process?
Over time, there has been a less volatile-moving motion to the upside in the BCH/USD trade operations since it entered a bearish condition. Presently, the crypto-economic market returns to a correction process to probably find support around $300 in the long run. The crypto economy may head down further to the previous lower support at $250 if it doesn’t get a stance to make a rebound for recovery.
On the downside of the technical analysis, the BCH/USD shoring of positions would have to have taken place beneath the $400. As of now, the $350 line happens to be immediate resistance to the current trading spot. A sudden bounce-off against the value-line will potentially lead the price back upward to attempt, breaking past it in the long-term run.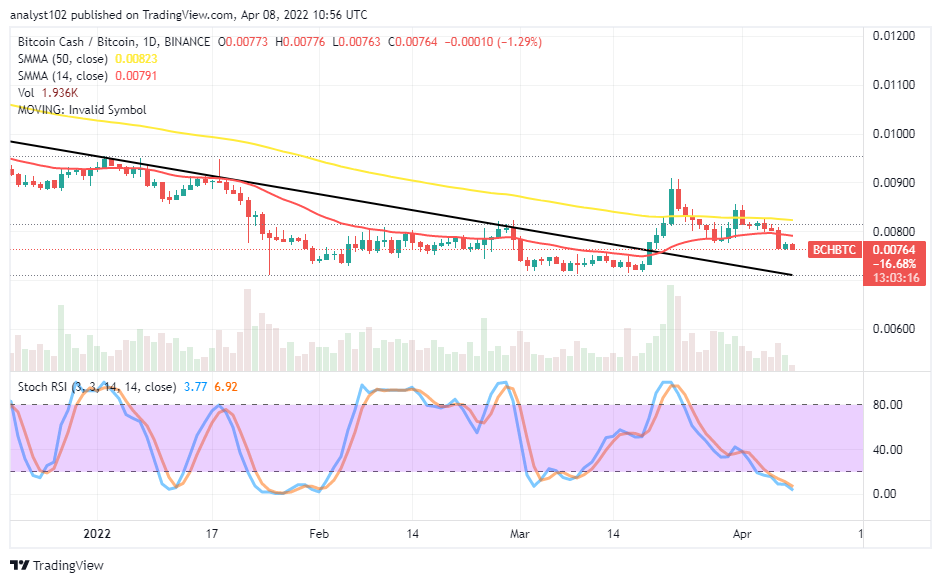 BCH/BTC Price Analysis
In comparison, Bitcoin Cash has lost the momentum to push against Bitcoin over a couple of sessions. The BCH/BTC analysis chart shows the market returns to a correction process, breaking past the SMA trend lines to the downside. The 50-day SMA indicator is above the 14-day SMA indicator. The Stochastic Oscillators have slantingly traveled southbound into the oversold region. A smaller bearish candlestick is in the making to signify the counter crypto’s pressure is prevailing over the base crypto.
Note: Cryptosignals.org is not a financial advisor. Do your research before investing your funds in any financial asset or presented product or event. We are not responsible for your investing results.
You can purchase Lucky Block here. Buy LBlock: