Polkadot (DOT/USDT) Eyes a Relief Bounce as Bulls React to Oversold Levels
Estimated Reading Time: 3 minutes
Don’t invest unless you’re prepared to lose all the money you invest. This is a high-risk investment and you are unlikely to be protected if something goes wrong. Take 2 minutes to learn more
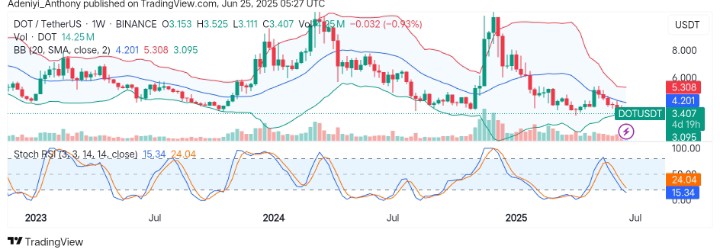
Polkadot Long-term Analysis: Ranging
The market for Polkadot against the Tether has reflected a cautious and bearish market sentiment. However, after failing to sustain the $7.00 to $8.00 range in early 2024, DOT retraced heavily and is now consolidating below the dynamic line of the Bollinger Bands, indicating a suppressed volatility zone.
Recently, the price action on the chart below shows a squeeze in the Bollinger Bands alongside a deeply oversold Stochastic RSI. This suggests that the market may be gearing up for a volatility breakout.
Currently, Polkadot trades at $3.407, realizing over 14.2 million traded for the week already.
Technical Indicators
Major Resistance Levels: $4.201, $5.308, and $6.000
Major Support Levels: $3.100, $2.700, and $2.000
Polkadot Technical Analysis
The analysis of Polkadot against the Tether on a weekly chart shows the pair has taken a turn to the south after failing to break above $4.201 in recent times. However, the current bull action suggests an intended move to the north as the price approaches the lower band level with compressing bands.
On the other hand, the Stochastic RSI appears to be in the oversold zone. However, the slight curvature of the lines and the decline in volume suggest buyers are already reacting to the market situation, but confirmation is needed before going long.
To this end, if the $3.095 can be strong support, a move above $4.201 may materialize soon; otherwise, the pair may see a continued downtrend.
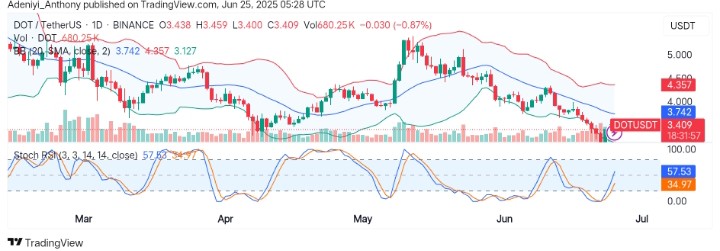
DOT/USDT Analysis: What’s Next: a Relief Bounce or Continued Downtrend?
On the daily chart, DOT/USDT is rebounding from the lower Bollinger Band at $3.12. However, the Stochastic RSI has crossed upward from the oversold zone, indicating bullish momentum, but the price appears to be below the 20-day SMA ($3.742), with declining volumes indicating the seller’s exhaustion.
To this end, a breakout above $3.500 may help the trajectory toward $3.740; otherwise, a break below $3.400 could indicate a retest of the $3.100 support level.
You can purchase crypto coins here. Buy LBlock