Polkadot (DOT/USDT) Sees Volatility Squeeze: What Happens Next?
Estimated Reading Time: 3 minutes
Don’t invest unless you’re prepared to lose all the money you invest. This is a high-risk investment and you are unlikely to be protected if something goes wrong. Take 2 minutes to learn more

Polkadot Long-term Analysis: Bearish
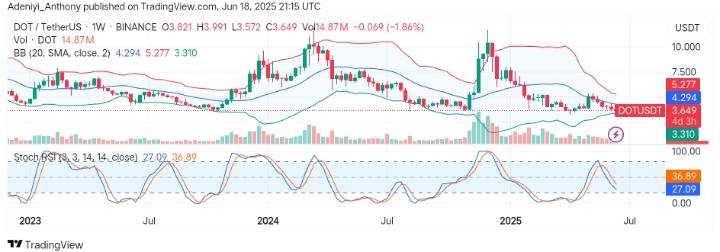
The market for Polkadot against the Tether has faced a prolonged downtrend for a considerable number of weeks after facing rejection at the dynamic band level. However, in the current week, the pair is displaying a momentum drop of over 1.80%, suggesting the current market direction may change soon.
Recently, the price action within compressed Bollinger Bands indicates waning volatility and a potential breakout. However, the Stochastic RSI remains near oversold, suggesting the bears are in control.
Currently, Polkadot trades at $3.649, printing over 14 million traded volumes for the week.
Technical Indicators
Major Resistance Levels: $4.2940, $5.2270, and $6.8000
Major Support Levels: $3.3100, $2.9000, and $2.4200
Polkadot Technical Analysis
From the weekly chart perspective, the value of Polkadot against the Tether appears to be nearing the lower band, indicating the pair is trading near volatility lows as the bulls expect a divergence in the price as it moves close to the $3.3100 historical low.
Also, the Stochastic RSI tends toward the extreme oversold region, indicating the pair may record further low value until the bulls decide to enter the market. However, the shrinkage in volume suggests an expansion ahead.
To this end, a bounce above $3.3100 may lead to a bullish reversal, potentially above $4.2940 in the coming session; otherwise, a fall below the immediate support may signal continued sideways movement with touches of marginal decline.
DOT/USDT Analysis: Will the Bulls Seize the Opportunity?
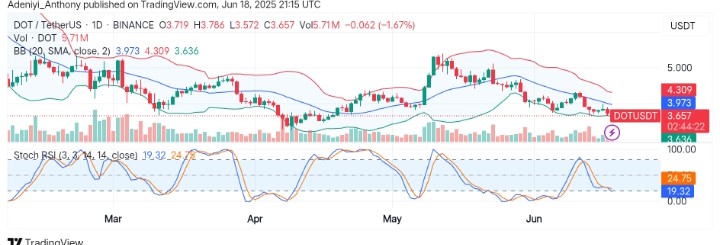
On the daily chart, DOT/USDT continues to trade below the mid-band, still reflecting a short-term bearish pressure. However, the positioning of the Stochastic oscillator as the extreme part of the oversold region hints at a limited downward momentum and the possibility for the bulls to reclaim previously lost positions.
To this end, with the potential expansion ahead, if the pair can close above $3.973 in the near term, a rally above $4.30 may be recorded; otherwise, a deeper retracement may be seen.
You can purchase crypto coins here. Buy LBlock