Maker (MKRUSD) Surges into Bullish Territory, Poised to Attain $1400 Price Milestone
Estimated Reading Time: 3 minutes
Don’t invest unless you’re prepared to lose all the money you invest. This is a high-risk investment and you are unlikely to be protected if something goes wrong. Take 2 minutes to learn more
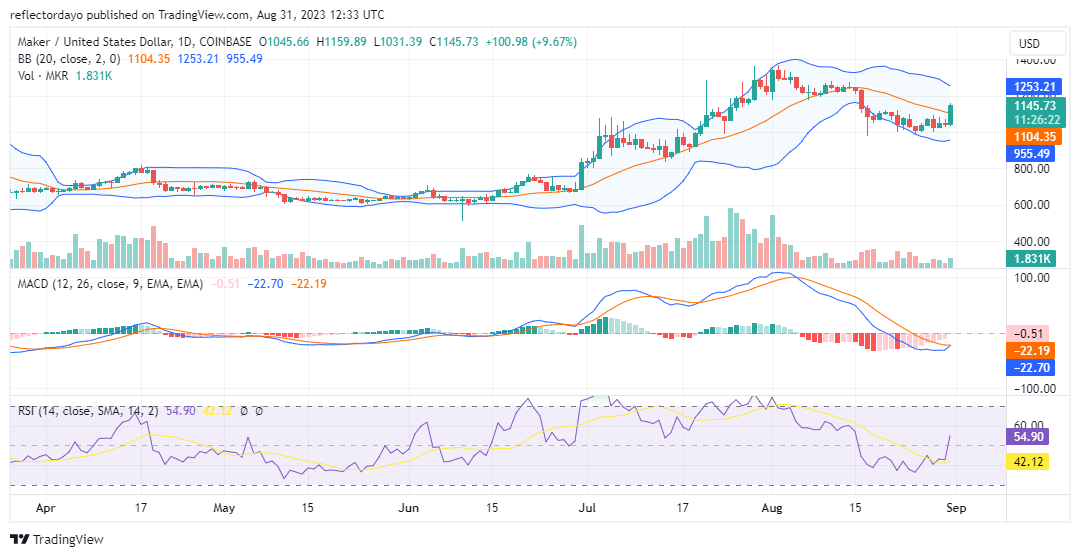
It appears that the Maker market is echoing historical patterns. Towards the close of the previous month, July, the market experienced a substantial price surge. This bull market reached its pinnacle around the $1400 price threshold before eventually stabilizing and establishing a pivot point (support level) at $1000. As August draws to a close today, a robust bullish candlestick has come into view, driven by bullish momentum propelling the market towards the $1200 price milestone.
Maker Market Data
- MKR/USD Price Now: $1147
- MKR/USD Market Cap: $1,118,344,055
- MKR/USD Circulating Supply: 977,631 MKR
- MKR/USD Total Supply: 977,631 MKR
- MKR/USD CoinMarketCap Ranking: #41
Key Levels
- Resistance: $1200, $1300, and $1400
- Support: $1000, $900, and $800.
Price Prediction for Maker: The Indicators’ Point of View
The Moving Average Convergence Divergence (MACD) is presently exhibiting a bullish crossover below the zero level, accompanied by diminishing height in its fading red histograms. Within the Relative Strength Index (RSI), the Maker market underwent a rapid and nearly vertical ascent from below the midpoint, highlighting the robustness of the bullish momentum.
However, the volume of trades suggests that the level of trading activity in today’s session isn’t proportionate to the pronounced bullish candlestick representing the current market conditions. It is conceivable that a handful of influential bulls within the market are executing substantial purchases. This significant buying activity holds the potential to reshape the market dynamics into a bullish trend, potentially motivating other traders to join in. Consequently, the trading volume is anticipated to rise as a result.
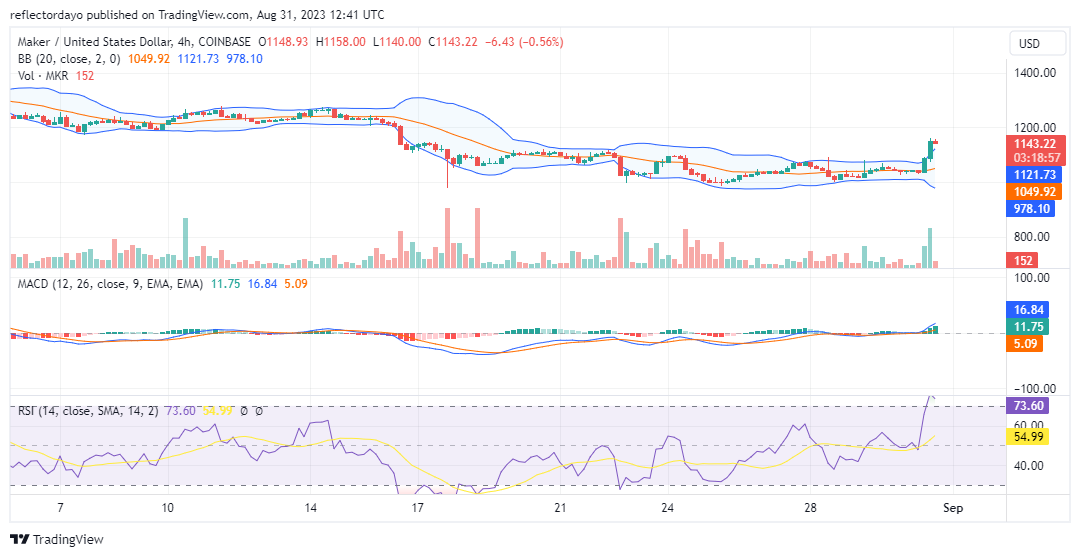
MKR/USD 4-Hour Chart Outlook
Examining the Maker market through the lens of the 4-hour chart provides an alternative viewpoint. In this context, the trading volume during periods of substantial bullish activity corresponds appropriately with the candlestick patterns. The extent of the bullish surge was substantial, potentially serving as a catalyst for a notable bearish market correction, which could potentially erode the gains established during the recent bullish phase. With growing volatility, there is an opening for bearish sentiment to gain traction within the market.
However, it’s important to note that the current situation suggests a corrective price rebound is unfolding rather than an imminent shift into a bearish phase.