Orchid (OXTUSD) Is Seeing a Shift from Stagnation to Upside Momentum
Estimated Reading Time: 3 minutes
Don’t invest unless you’re prepared to lose all the money you invest. This is a high-risk investment and you are unlikely to be protected if something goes wrong. Take 2 minutes to learn more

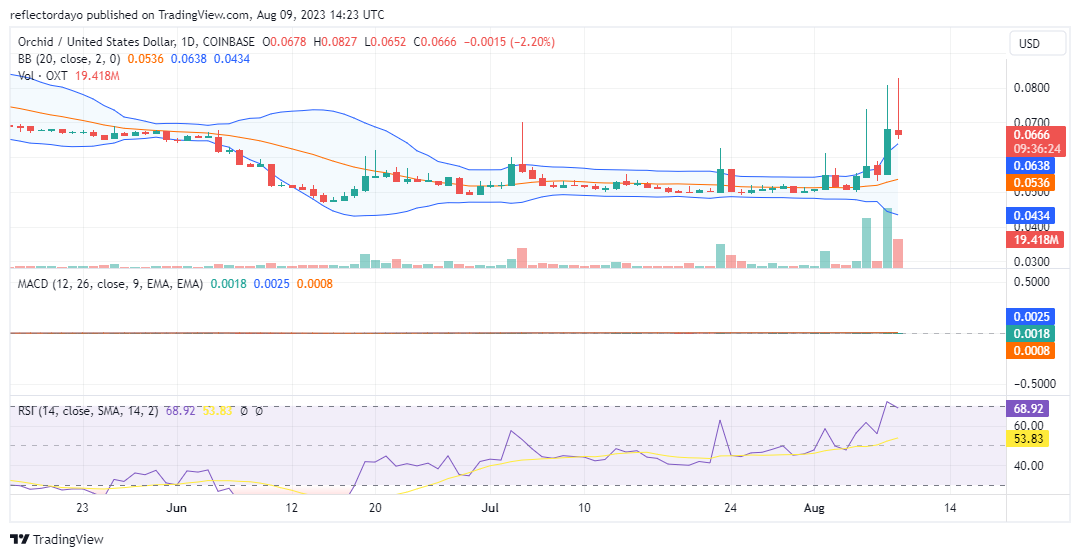
The Orchid market (OXTUSD) has been characterized by a period of relative flatness, marked by predominant doji candlesticks that symbolize the indecisiveness of daily trading sessions since the onset of July. Despite this, intermittent bullish price spikes have punctuated this uneventful phase. However, the landscape shifted notably from August 6 onward as a discernible uptrend gained traction, effectively breaking the prolonged stalemate that had been centered around the $0.0527 horizontal price level.
Orchid Market Data
- OXT/USD Price Now: $0.06634
- OXT/USD Market Cap: $63,857,705
- OXT/USD Circulating Supply: $962,629,339
- OXT/USD Total Supply: 1,000,000,000 OXT
- OXT/USD CoinMarketCap Ranking: #317
Key Levels
- Resistance: $0.0760, $0.080, and $0.085.
- Support: $0.0630, $0.060, and $0.058.
Price Prediction for Orchid: The Indicators’ Point of View
This bullish breakout is distinctly reflected in the behavior of the Bollinger Bands, which have shown a marked divergence, signifying the increased volatility accompanying the upward movement. The momentum behind this bullish surge propelled the Orchid price to test the $0.0800 price threshold, signaling heightened buying interest. However, the market encountered resistance at this level and was unable to maintain a steady position even within the $0.07 price range, ultimately settling just below the $0.07 mark.
It’s important to note that this robust bearish response at the $0.07 price zone could be attributed to the overextended bullish sentiment that preceded it. The swift and substantial rally might have incited profit-taking and caution among traders, leading to the observed pullback.
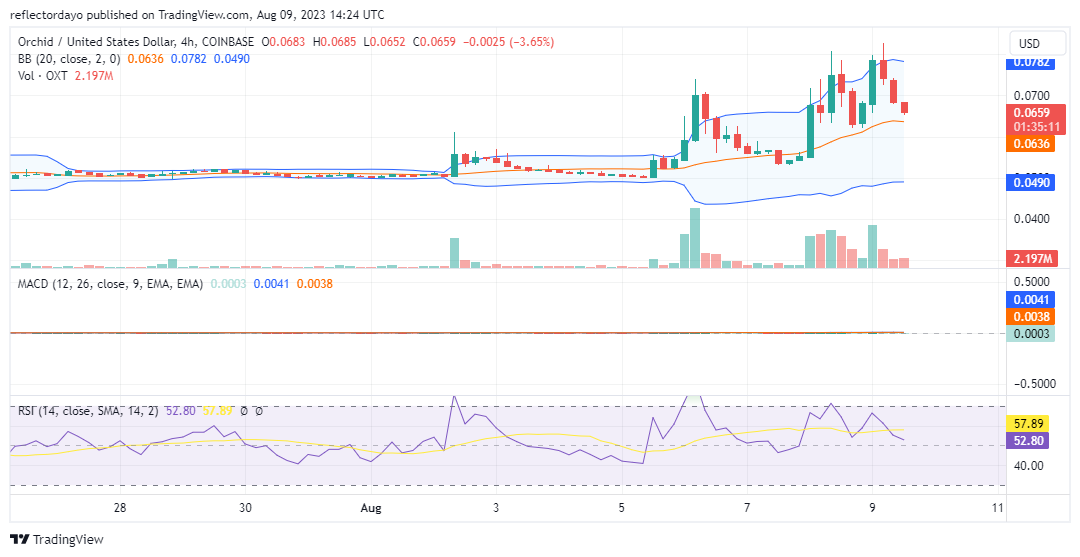
OXT/USD 4-Hour Chart Outlook
The Orchid market has transitioned from a period of stagnation marked by doji candlesticks to a phase of renewed upside momentum. The bullish breakout has successfully breached the long-standing horizontal resistance at $0.0527, with the Bollinger Bands reflecting the increased volatility accompanying this move. The attempt to breach the $0.0800 price level was met with resistance, resulting in a bearish pullback around the $0.07 price zone. This shift in market dynamics underscores the importance of monitoring sentiment and potential overextension in such hyperbullish scenarios.