Litecoin (LTC/USD) Price Is Under a Force, Attempting a Correction
Estimated Reading Time: 3 minutes
Don’t invest unless you’re prepared to lose all the money you invest. This is a high-risk investment and you are unlikely to be protected if something goes wrong. Take 2 minutes to learn more
Litecoin Price Prediction – April 30
Indications are showing that falling activities are still going to overrule some price responses in the operations of Litecoin trade versus the market worth of the US Dollar, as it has been witnessed that the trade is under a force that is capable of making the exchange line attempt a correction further.
Given the oscillators’ current repositioning posture and the bearish candlestick they are coupling with, it is unlikely that a bullish candlestick would resurface soon enough to invalidate the process. However, the execution of new shorting orders might not pick up enough momentum to produce fast, frightful drops toward new sellers. For the time being, it makes more sense for bulls to hold off on entering the market until the downward trend has been exhausted.
LTC/USD Market
Key Levels:
Resistance levels: $75, $80, $85
Support levels:$65, $60, $55
LTC/USD – Daily Chart
The LTC/USD daily chart showcases that the crypto market is under force, attempting a correction further.
The pressures on the market to the downside have been slowly staging to average the positional spot of the lower Bollinger Band trend line. The stochastic oscillators have been having the blue part make efforts to move across the red line to the downside. And they are seen around the point of 40.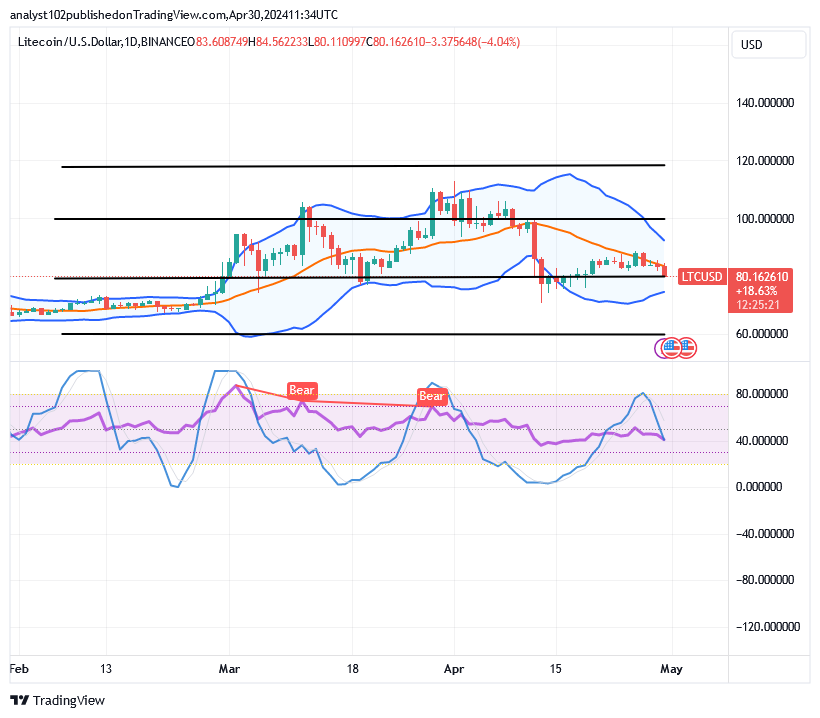
Should sellers anticipate more lows in the LTC/USD staging around the lower Bollinger Band following the formation of a bearish candlestick presently?
Envisaging further reductions in the LTC/USD market to stage alongside the lower Bollinger Band indicator appears not to gain much of the required weight to maintain some degrees of perfection, given that the crypto economy is under a force attempting a correction.
As there has been a slight steady declining motion in the market, the price needs to be allowed to touch the trending axis of the lower Bollinger Band with a line of securing rebounds before launching an instant longing position order. Buyers should take psychological precautions and use a protective trade strategy when retreating from the underlying supports, which have been established at $65 and lower.
Because the indications are approaching close to the near endpoints, it may have been too late for sellers to take advantage of the current downward movement. Even in the long-term running style, the moves to the south may not go beyond the points of $65 and $60 at most.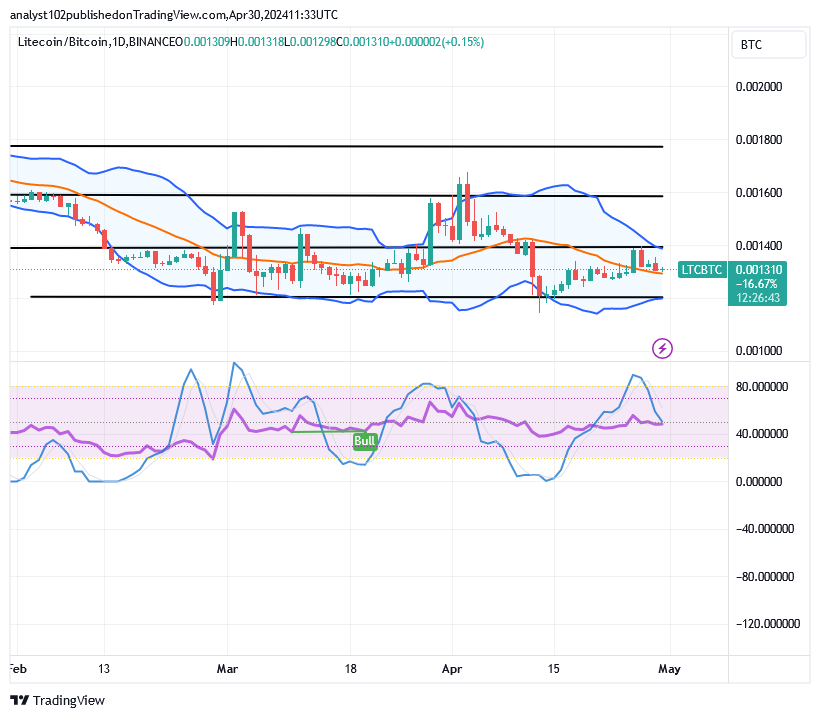
LTC/BTC Price Analysis
In contrast, the Litecoin market has been placed under pressure against the trending weight of Bitcoin, attempting a correction.
The zones that the base cryptocurrency instrument might be forced to touch in order to restart the momentum-building process are represented by the Bollinger Band trend lines. The stochastic oscillators are inclined to retrace their path southward. Additionally, they are situated just above the 40-point. It suggests that there may be some delays until the counter-crypto device loses its overwhelming potency.
Note: Cryptosignals.org is not a financial advisor. Do your research before investing your funds in any financial asset or presented product or event. We are not responsible for your investing results.
You can purchase Lucky Block here. Buy LBLOCK