Litecoin (LTC/USD) Market Characterizes by Tinier Ups
Estimated Reading Time: 3 minutes
Don’t invest unless you’re prepared to lose all the money you invest. This is a high-risk investment and you are unlikely to be protected if something goes wrong. Take 2 minutes to learn more

Free Crypto Signals Channel
Litecoin Price Prediction – August 9
The trending motion outlook of the LTC/USD shows the market characterizes by tinier ups over a couple of sessions. As of the time of writing, the price trades around the $62 value line at an average minute percentage rate of 0.68 negative.
LTC/USD Market
Key Levels:
Resistance levels: $70, $80, $90
Support levels: $50, $40, $30
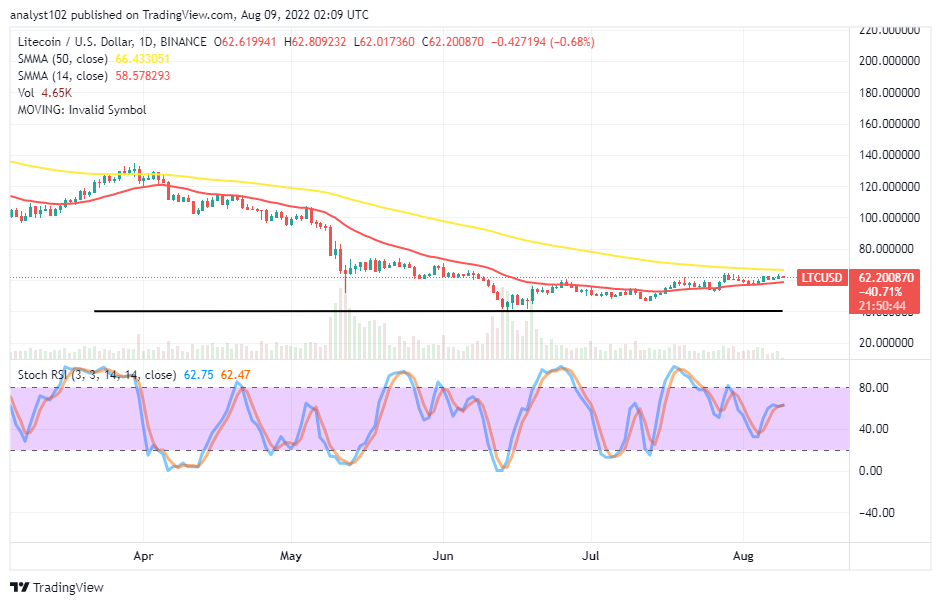
LTC/USD – Daily Chart
The LTC/USD daily chart reveals the market characterizes by tinier ups over several trading sessions below the trend line of the bigger SMA. The 14-day SMA indicator is at $58.58, underneath the $66.43 value line of the 50-day SMA indicator. The horizontal line drew at the $40 support level, showcasing the critical baseline that the price had earlier in the past approached before the start of the slow rallying movement until the present. The Stochastic Oscillators have closed the lines at around the 65 range, denoting that a recession will play out in the following sessions.
What should traders continue to launch orders as the LTC/USD trade recesses at this point?
Most of the time, any pairing trading instrument recesses, and traders are to stay off at that moment for some. As the LTC/USD market operation characterizes by tinier ups, trading activities needed to suspend for a while. Long-position placers should allow the crypto’s price to go down through the trend line of the 14-day SMA to get repositioned for momentum mustering afterward before deciding to place a buying order.
On the downside of the technical analysis, the LTC/USD market bears may have to watch out for a situation where the price will pull up falsely toward resistances such as $66.43 and $70, and on the active reversal against the motion, shorting activities can then take place. Mindfully, that assumption may not happen in the near time as the recess-trading outlook tends to prolong.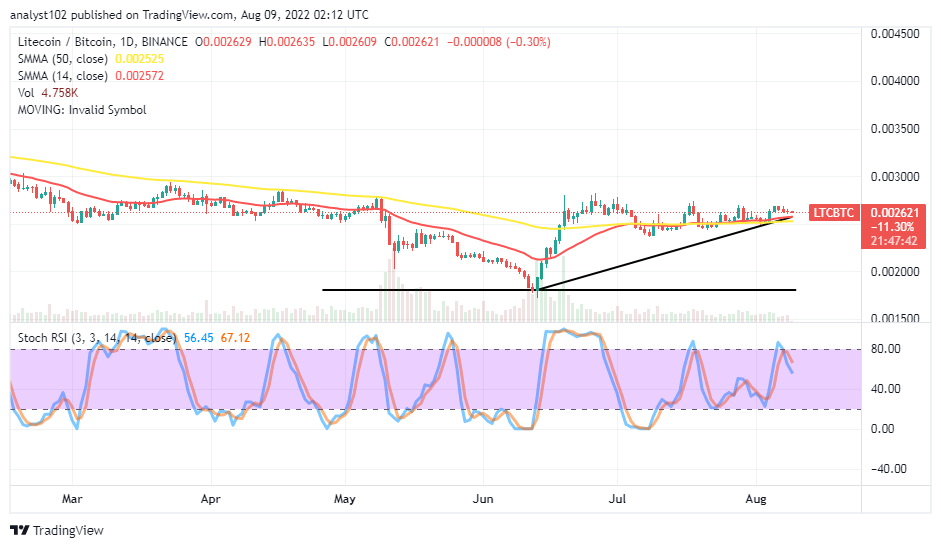 LTC/BTC Price Analysis
Litecoin, compared with Bitcoin’s trending capability as of the present, has been moving in a range around a higher-resistance trading spot. The cryptocurrency pair price characterizes by tinier ups around the conjoined area of the 14-day SMA indicator and the 50-day SMA indicator. The Stochastic Oscillators have crossed southbound slightly from the range of 80. And they are still pointing toward the south direction. The pairing crypto is closely trading below a near overhead barrier, standing against any smooth-running attempt the base crypto might intend to make. It seems the current ranging outlook will persist for a while.
Note: Cryptosignals.org is not a financial advisor. Do your research before investing your funds in any financial asset or presented product or event. We are not responsible for your investing results.
You can purchase Lucky Block here. Buy LBLOCK