Polkadot (DOT/USDT) Poised for a Potential Trend Reversal
Estimated Reading Time: 3 minutes
Don’t invest unless you’re prepared to lose all the money you invest. This is a high-risk investment and you are unlikely to be protected if something goes wrong. Take 2 minutes to learn more
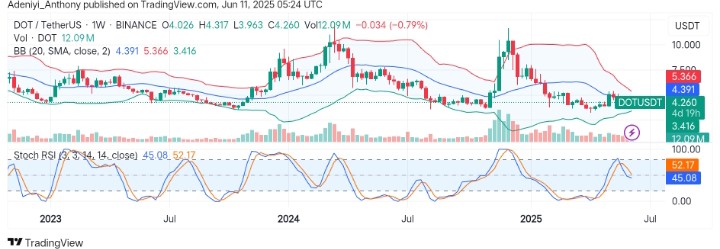
Polkadot Long-term Analysis: Ranging
As of June 2025, the market for Polkadot against the Tether is exhibiting signs of a potential upside comeback after a prolonged consolidation phase. However, the pair appears to be sitting above the lower line of the Bollinger Bands, displaying early signs of bullish divergence, indicating cautious accumulation.
Recently, the price action shows that the pair is testing lows near the $3.600 level as more buyers entered the market. However, the trading volume for the week appears to be dwindling by a small margin, suggesting momentum may be fragile and lack directional conviction.
Currently, Polkadot trades at $4.260, printing over 12 million traded volumes.
Technical Indicators
Major Resistance Levels: $5.366, $6.800, and $7.500
Major Support Levels: $4.000, $3.416, and $3.000
Polkadot Technical Analysis
On the weekly timeframe, Polkadot against the Tether appears to be forming a rounded base between $3.416 and $4.000 as the price proceeds from the lower band level to hover around the dynamic level of the Bollinger Bands at $4.391. This suggests a mild reversion, which often precedes a bullish signal.
From another angle, the Stochastic RSI appears to operate the mid-level with a flat blue line at 45.08. However, the current state of the traded volumes suggests a lack of institutional participation.
To this end, if the pair sees more participation in a break above the $4.391, a move
toward the $5.000 level may be seen; otherwise, a continued consolidation may be seen for a long time.
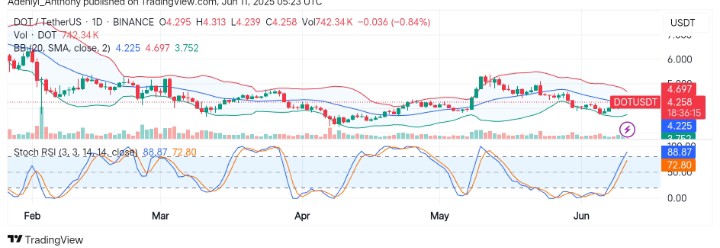
DOT/USDT Analysis: What’s Next?
On the daily chart, DOT/USDT appears to be exhibiting some of the weekly features. However, the price seems to hold above the $4.255 dynamic level after emerging from the lower band of a compressing Bollinger Band. This implies a volatility compression, indicating a potential big move ahead.
From another side, the momentum oscillator looks unbothered progressing with its bullish crossover as both lines extend their run into the overbought region despite the volume level. This indicates the pair may form a new lower high in the short term if no major rejection is recorded.
To this end, a break above $4.390 with a strong volume in the near term may suggest a move towards a short-term target around $4.700.
You can purchase crypto coins here. Buy LBlock