Polkadot (DOT/USDT) Bulls Eye a Move Above $4.490 Dynamic Level
Estimated Reading Time: 3 minutes
Don’t invest unless you’re prepared to lose all the money you invest. This is a high-risk investment and you are unlikely to be protected if something goes wrong. Take 2 minutes to learn more
Polkadot Long-term Analysis: Ranging
After months of sideways movement, the market for Polkadot against Tether appears to be cautiously bullish, recording an increase of 0.99% in bullish influx. The pair has shown resilience by maintaining a structure close to the mid-band of the Bollinger Bands, suggesting bullish traders hope for a position above the $4.490 level.
Recently, the price action shows the pair is aiming for an upside movement as buying volumes increase and the Bollinger bands tighten, hinting at a potential big move in the near term. However, the Stochastic RSI shows the momentum dwindles as the blue drops back to the midpoint value.
Currently, Polkadot trades at $4.178, recording over 8 million traded volumes for the week.
Technical Indicators
Major Resistance Levels: $4.490, $5.730, and $7.500
Major Support Levels: $4.000, $3.260, and $2.900
Polkadot Technical Analysis
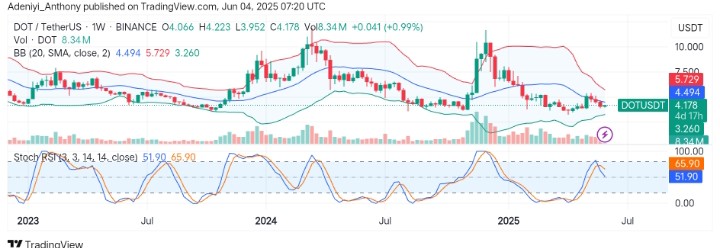
The analysis of Polkadot against the Tether on the weekly timeframe shows the pair coiling towards the north as the price gradually changes direction. The Bollinger appears to be squeezing, indicating a potential large move ahead. However, the volume remains relatively stable, as the Stochastic RSI hints at a drop in strength.
To this end, a weekly close above $4.500 with an increase in volume would suggest a move toward the $5.730 level; otherwise, a break below the immediate support would signal a fall in the value of the pair.
DOT/USDT Analysis: Where from Here?
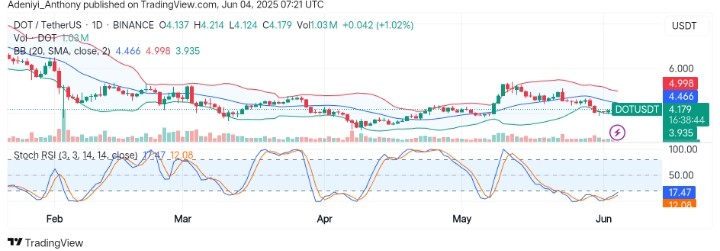
On the daily chart, DOT/USDT appears to be bouncing off the $3.935 lower Bollinger Band, indicating that local support is holding. However, the Bollinger Bands seem to converge, setting the stage for a volatility breakout with a modest daily trading volume.
From another angle, the oscillator beneath the chart suggests the price may be heading to the 20-mark as the lines face the north, hinting at a long-term bullish move.
To this end, a move above $4.460 with a stronger volume would confirm a move to the north.
You can purchase crypto coins here. Buy LBlock