Lucky Block Price Prediction: LBLOCK/USD Could Retrace Above $0.000180
Estimated Reading Time: 3 minutes
Don’t invest unless you’re prepared to lose all the money you invest. This is a high-risk investment and you are unlikely to be protected if something goes wrong. Take 2 minutes to learn more

Lucky Block Price Prediction – March 22
The Lucky Block price rebounds from the early dip at $0.000150 as the buying interest may increase on approach to $0.000180.
LBLOCK/USD Long-term Trend: Ranging (1D Chart)
Key levels:
Resistance Levels: $0.000240, $0.000260, $0.000280
Support Levels: $0.000100, $0.000080, $0.000060
LBLOCK/USD is ranging as the market could establish a cross above $0.000170 but currently rebounding to retain the previous resistance at $0.000180. The buyers may begin to look for some resistance levels if the coin crosses above the upper boundary of the channel.
Lucky Block Price Prediction: LBLOCK Price May Reclaim $0.000180 Resistance
In the past few hours, after the Lucky Block price touches the daily low of $0.000150, the king coin could now face the resistance level of $0.000200 and look forward to hitting the resistance level of $0.000220. However, the daily chart reveals that if the 9-day moving average crosses above the 21-day moving average, it will confirm the next direction of the coin.
At the moment, the technical indicator Relative Strength Index (14) may likely cross above the 60-level to indicate a bullish movement. Therefore, if the Lucky Block price crosses above the channel, it could hit the resistance levels of $0.000240, $0.000260, and $0.000280, but any bearish movement below the lower boundary of the channel could hit the supports at $0.000100, $0.000080, and $0.000060.
LBLOCK/USD Medium-Term Trend: Ranging (4H Chart)
According to the 4-hour chart, the Lucky Block price is ranging below the 9-day and 21-day moving averages as the technical indicator Relative Strength Index moves below the 50-level. From above, if the Lucky Block price crosses above the 9-day and 21-day moving averages, the bullish influence could spike, and the accrued gains toward the upper boundary of the channel.
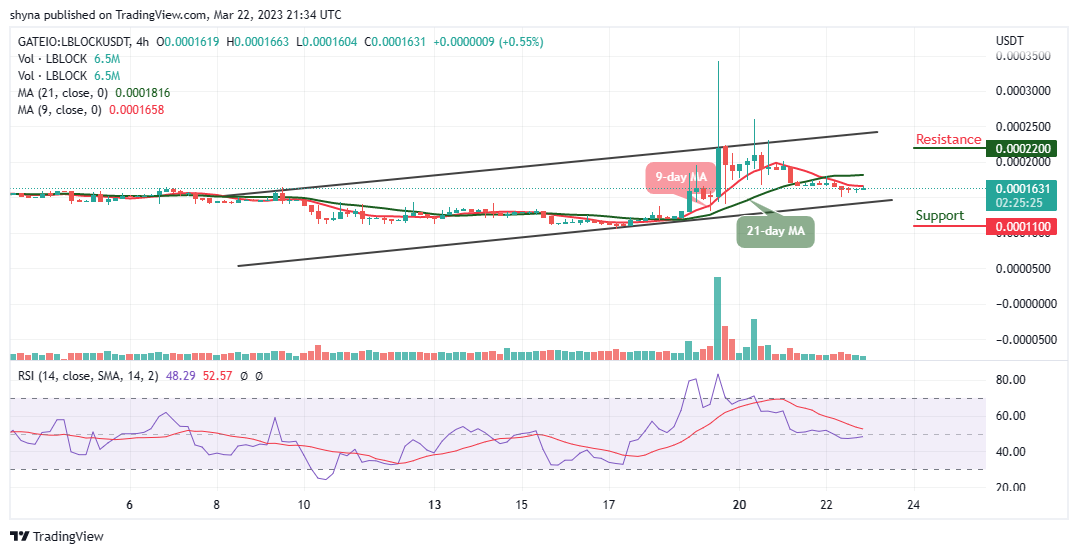
However, the current candle could fail to cross above the 9-day moving average, and the support level could be found at $0.000110 and below but the best the bulls can do is to hold above the resistance level of $0.000180 and keep their attention on breaking the potential resistance at $0.000220 and above.
You can purchase Lucky Block here. Buy LBLOCK