Ethereum (ETH/USD) Trade Makes a Pull-Up After a Sudden Decline
Estimated Reading Time: 3 minutes
Don’t invest unless you’re prepared to lose all the money you invest. This is a high-risk investment and you are unlikely to be protected if something goes wrong. Take 2 minutes to learn more
Ethereum Price Prediction – April 19
There has been a gradual recovery moving mode in the market operation of ETH/USD as it witnessed an abrupt downward move during the April 18th day’s session.
ETH/USD Market
Key Levels:
Resistance levels: $2,400, $2,600, $2,800
Support levels: $1,900, $1,700, $1,500
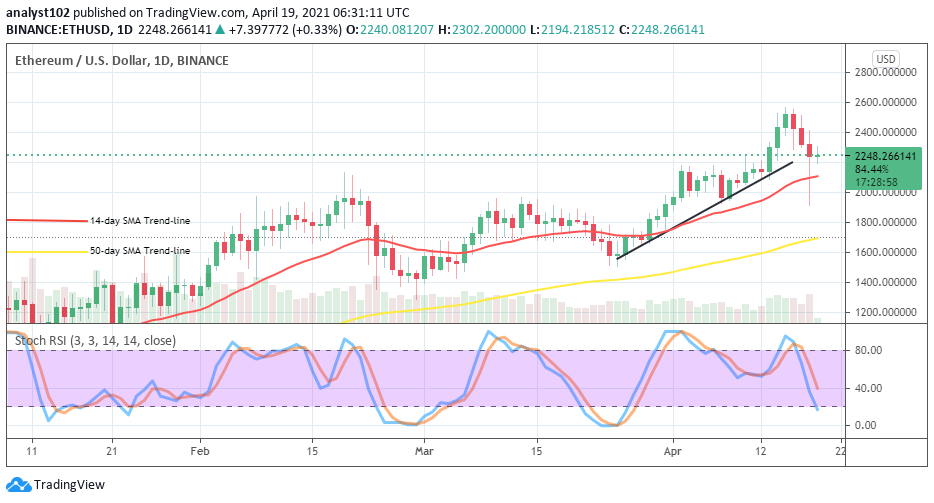
ETH/USD – Daily Chart
The emergence of April 18 candlestick gave a line of panic sell-off trading outlook as price gut a drop to the tune of $1,900 immediate support area of the market. Now, the length of the bearish candlestick has got reduced to about a quarter upwardly to signal a pull-up move. As of writing, another candlestick has taken its formation from the support of the $2,200 line. The 14-day SMA and the 50-day SMA still maintain their postures pointing to the north. The Stochastic Oscillators have extended their hairs to range 20 in an attempt of getting set to cross back to the north. If that eventually achieved, it will mean a clear sign of probably seeing a return of bullish move in the market.
Will the $2,200 level play a vital in the ETH/USD market again?
Based on the ETH/USD recent financial record, the $2,200 trading level has been majorly featuring in the ups and downs of this crypto-market operation. In the light of that, it means it will have to be taken into consideration especially when price tends to make notable moves. So being as it is, the buyers are expected to stage their entry position around the level while the price action comes up in the market.
It now appears that the bears are losing their stance slowly in the ETH/USD trade as a sharp decline has been made by the bulls to short-live. Therefore, a sell order may have to be awaited to form again at around a higher point of $2,600 or, at a higher trading zone. However, a timely breakdown of the $2,200 market level will signal the continuation of making more downsides in the crypto-trade.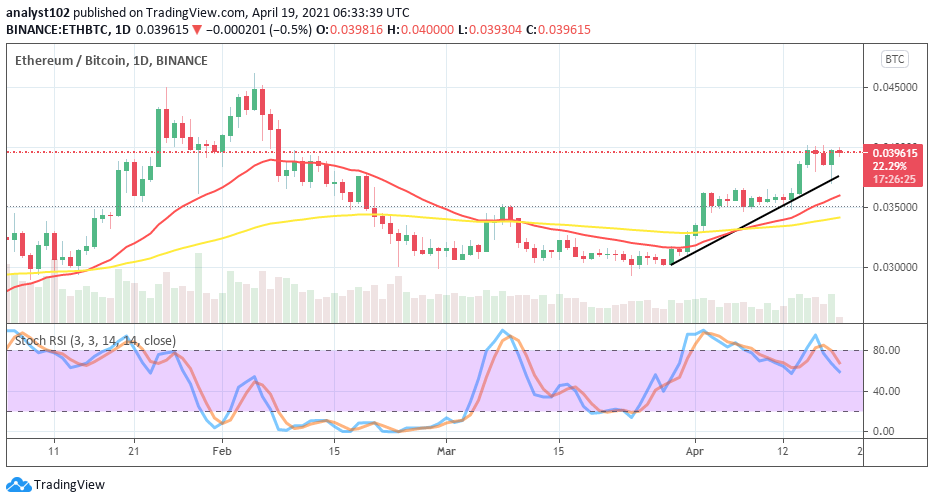
ETH/BTC Price Analysis
A set of about four daily candlesticks have converged at a higher point to showcase that ETH is currently waxing more efforts to outweigh the worth of BTC in comparison. The 50-day SMA indicator is underneath the 14-day SMA trend-line. And, they are below the level at which the base crypto is trying to push northward further against the value of the counter trading instrument. The Stochastic Oscillators have slightly bent across range 80 to around range 60 in a brief-pointing mode to the south. That suggests play out of a slow-moving motion is ongoing before the next distinct direction surfaces.
Note: cryptosignals.org is not a financial advisor. Do your research before investing your funds in any financial asset or presented product or event. We are not responsible for your investing results.