Dogecoin (DOGE) Price Prediction: DOGE/USDT Market Tracks a Two-Month High
Estimated Reading Time: 3 minutes
Don’t invest unless you’re prepared to lose all the money you invest. This is a high-risk investment and you are unlikely to be protected if something goes wrong. Take 2 minutes to learn more
Date: July 14, 2025
As Bitcoin continues its strong rally, other altcoins like Dogecoin are beginning to gain moderate traction as well—despite the fact that the altcoin season is yet to fully arrive. While this momentum lasts, let’s examine how the DOGE market might perform in the near term.
Dogecoin (DOGE) Price Prediction: DOGE/USDT Long-Term Trend — Bullish (Daily Chart)
Key Price Levels:
Resistance: $0.2250, $0.2500, $0.2750
Support: $0.2000, $0.1800, $0.1600
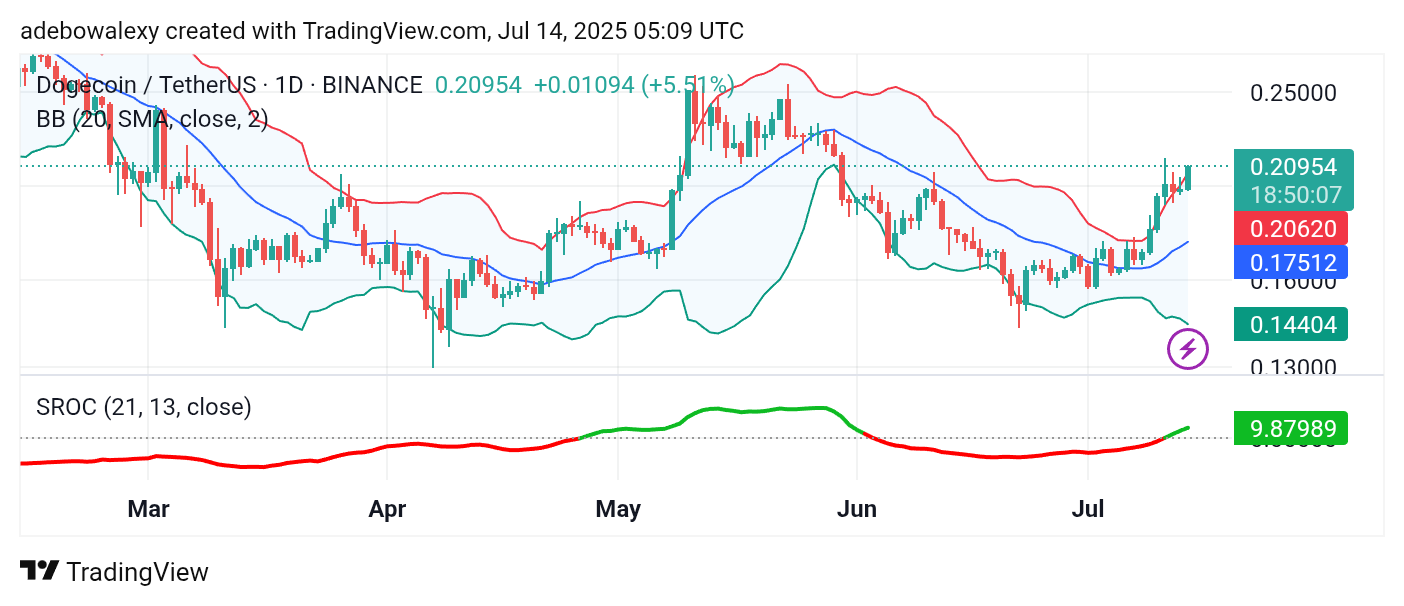
The Dogecoin market has been on a consistent upward trajectory on the daily chart since June 21st, when price action rebounded from the $0.1440 support level. The current price candle is a strong green one and significantly larger than the previous session’s, pushing the market above the upper band of the Bollinger Bands (BB) indicator. Additionally, the Smoothed Rate of Change (SROC) indicator line has punched through the equilibrium level, indicating rising bullish momentum.
Dogecoin (DOGE) Price Prediction: DOGE/USDT Bull Appears Ready for Continued Ascent
The ongoing session in the Dogecoin market suggests that bullish forces remain strong. As a result, price action may continue its upward movement.
The token is currently trading at a level last seen in late May, with the latest price candle extending above the upper limit of the BB indicator.
Similarly, the SROC indicator line remains firmly projected upward above the equilibrium level, reinforcing the bullish sentiment and suggesting that further upward movement is likely.
Dogecoin (DOGE) Price Prediction: DOGE/USDT Bullish Sentiment Strengthens (4-Hour Chart)
Price activity on the 4-hour chart indicates that DOGE may be preparing for a stronger bullish correction. The BB indicator has converged noticeably, while the last two price candles have risen above the middle band of the BB and are now testing the upper band.
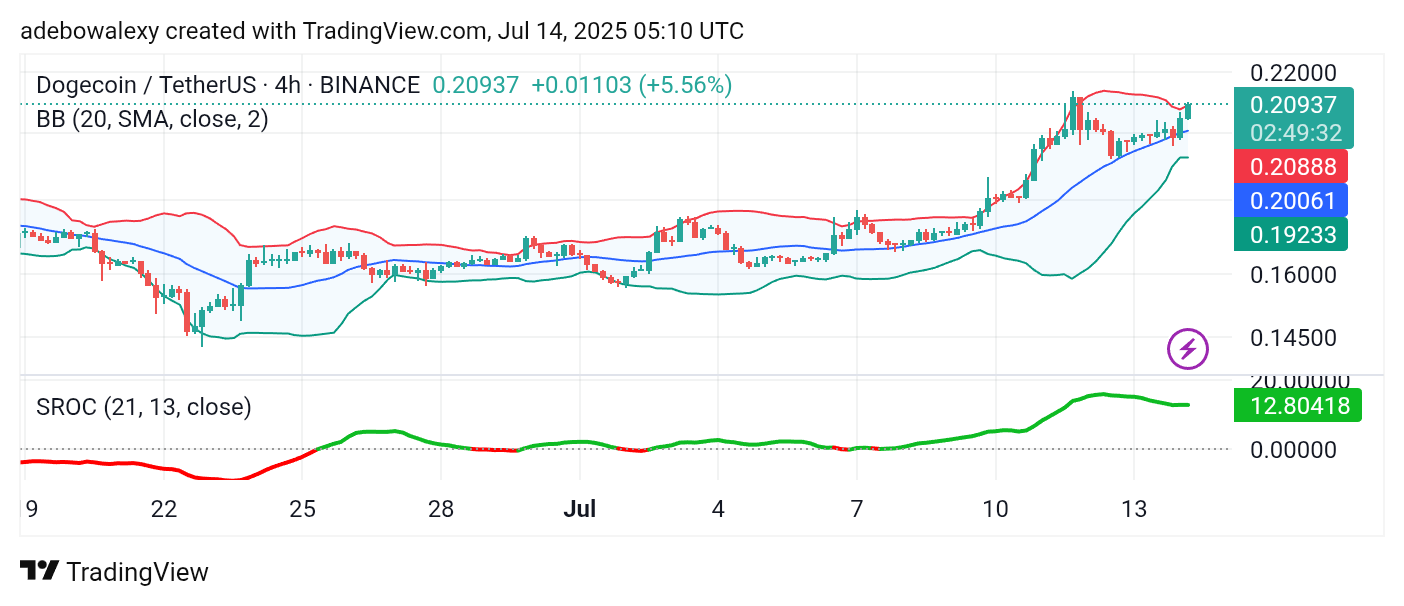
Meanwhile, the SROC indicator line remains above the equilibrium level and appears to be shaping into a stronger upward trajectory. Consequently, this market may soon push through the nearby resistance at $0.2200, with the potential to approach the $0.2500 mark in the near term.