POL (prev. MATIC) Price Prediction: POL/USDT Races Toward the $0.2500 Mark
Estimated Reading Time: 2 minutes
Don’t invest unless you’re prepared to lose all the money you invest. This is a high-risk investment and you are unlikely to be protected if something goes wrong. Take 2 minutes to learn more

Date: July 12, 2025
The POL (prev. MATIC) market, being well correlated with Bitcoin, has been on a strong upward retracement since the Bitcoin market regained significant upside momentum. At this point, the market is sustaining above the $0.2280 price level, remaining well positioned for further upward continuation.
POL (prev. MATIC) Price Prediction: POL/USDT Long-Term Trend—Bullish (Daily Chart)
Key Price Levels:
Resistance: $0.2500, $0.2750, $0.3000
Support: $0.2200, $0.2000, $0.1750
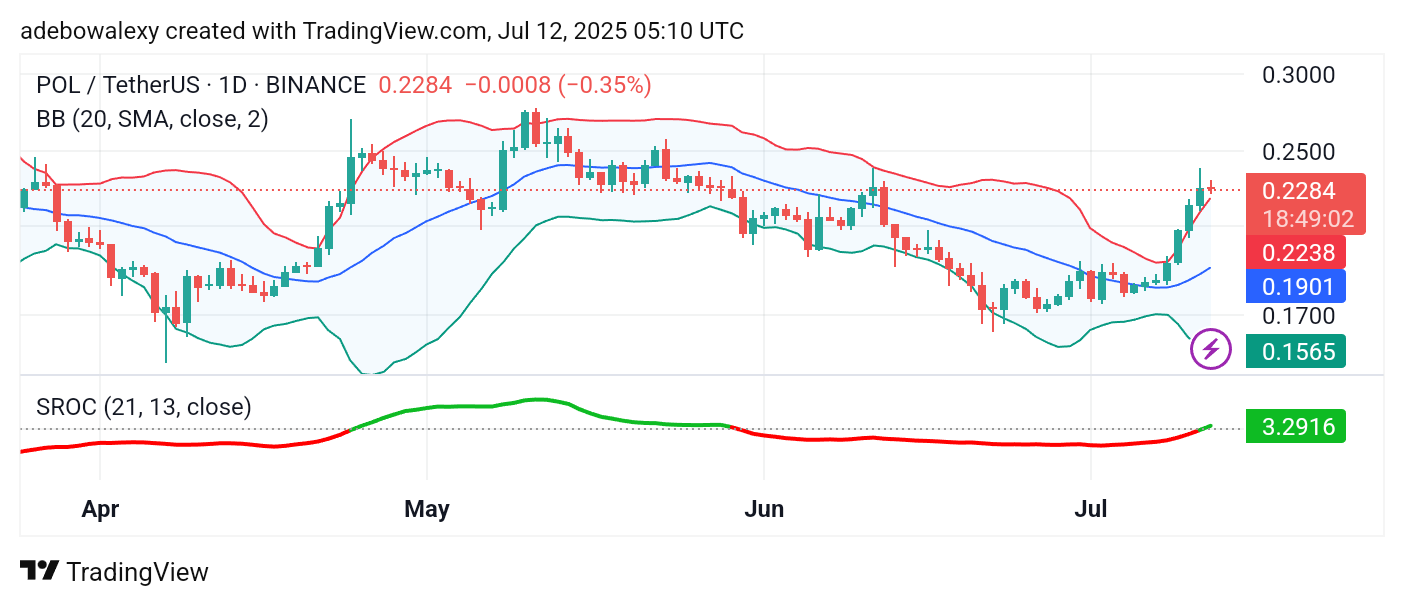
Price action in the POL (prev. MATIC) market has resurfaced above the $0.2000 price level. The Bollinger Bands (BB) indicator is tilted upward and remains significantly widened. Price action also stays above the upper band of the BB indicator. The ongoing session is represented by a bearish candle, yet the token remains elevated, continuing to trade above the \$0.2280 level. Additionally, the Smoothed Rate of Change (SROC) indicator line has moved above the equilibrium level.
POL (prev. MATIC) Price Prediction: POL/USDT Bullish Prospects Remain Strong
As noted earlier, the POL (prev. MATI) token has gained notable traction recently. For the most part, recent sessions have closed in the green. Price action has consistently remained above the upper band of the BB indicator.
The last candle on the daily chart is red, indicating a short-term pullback— a normal occurrence following an extended upward move. The SROC indicator continues to confirm that bullish momentum remains intact and suggests a likelihood of further upward movement.
POL (prev. MATIC) Price Prediction: POL/USDT Maintains Strong Position (4-Hour Chart)
Even on shorter time frames, price activity remains at elevated levels. The latest candle on the 4-hour chart is bearish and appears larger than its counterpart on the daily chart.
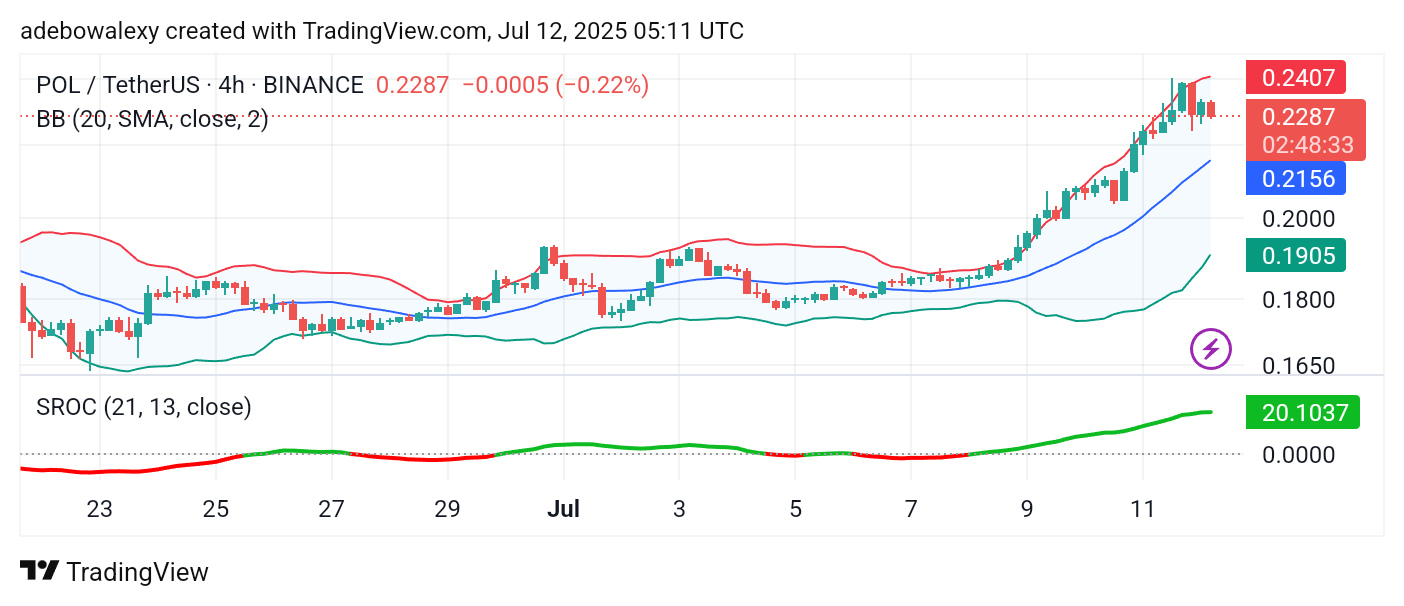
Price action has dipped below the upper band of the BB indicator but continues to hover around it.
The SROC indicator line has just moved above the equilibrium level, reinforcing the likelihood that bullish momentum will continue to push the market toward the $0.2500 mark.