Solana (SOL) Price Prediction: SOL/USDT Aims Toward the $180 Mark
Estimated Reading Time: 3 minutes
Don’t invest unless you’re prepared to lose all the money you invest. This is a high-risk investment and you are unlikely to be protected if something goes wrong. Take 2 minutes to learn more

Date: July 11, 2025
The Solana market has experienced a significant upside recovery over an extended period, beginning with the last rebound off the support near the $130 price level. However, the bullish retracement gained notable momentum after price action broke above the $150 resistance level. Let’s take a closer look at the market dynamics.
Solana (SOL) Price Prediction: SOL/USDT Long-Term Trend—Bullish (Daily Chart)
Key Price Levels:
Resistance: $180.00, $200.00, $220.00
Support: $160.00, $140.00, $130.00
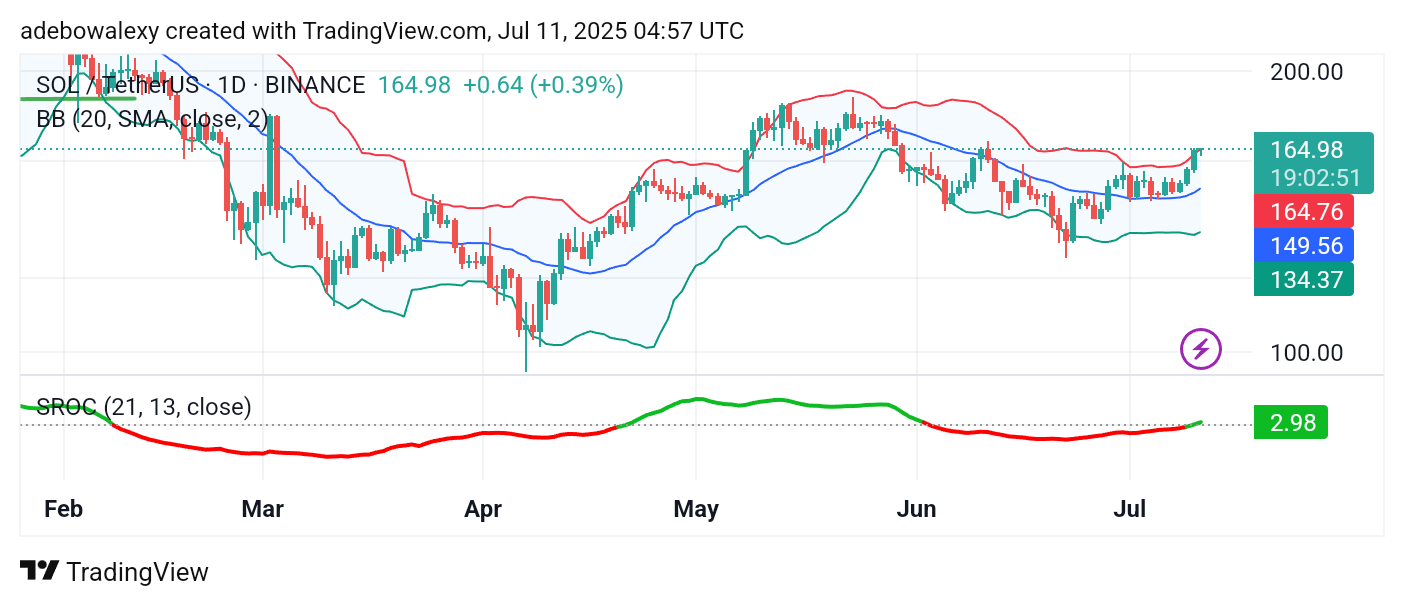
Price activity on Solana’s daily chart is currently hugging the uppermost band of the Bollinger Bands (BB) indicator. The most recent candle, corresponding to the ongoing session, is green and clings to the upper limit of the BB indicator. As a result, the bands are beginning to widen, signaling increasing volatility. Meanwhile, the terminal end of the Smoothed Rate of Change (SROC) indicator continues to climb upward after crossing above the equilibrium line—confirming a strong bullish trend.
Solana (SOL) Price Prediction: SOL/USDT Rides Strong Momentum
Based on movement on the daily chart, the bullish sentiment in the Solana market remains firm. As previously mentioned, the renewed positive sentiment surrounding Bitcoin appears to be a major catalyst.
Solana’s price action continues to linger around the upper band of the BB indicator, and the SROC indicator further supports the current uptrend. The terminal end of the SROC line is still pointing upward, well above the equilibrium level, which signals that SOL remains well-positioned for continued upward movement.
Solana (SOL) Price Prediction: SOL/USDT Heads Toward $170 (4-Hour Chart)
On the 4-hour chart, Solana continues its climb, targeting higher levels. The price action is represented by small but consistently green candles, indicating sustained bullish pressure.
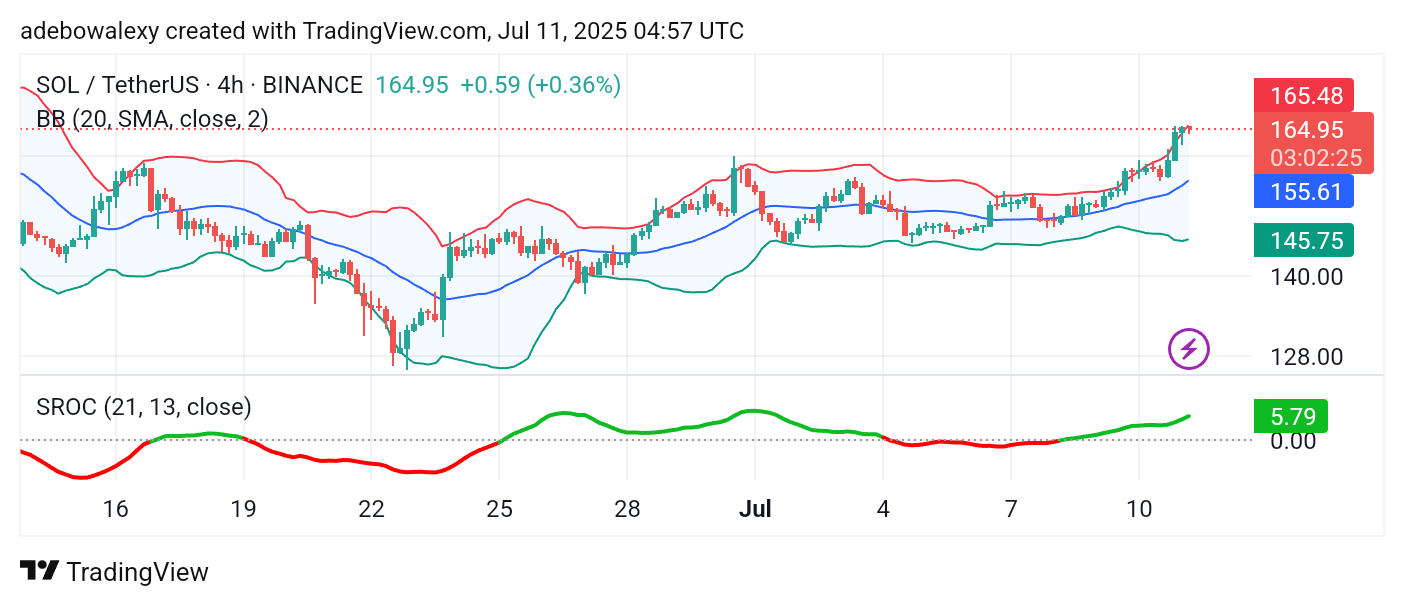
As with the Solana daily chart, the 4-hour market trades along the uppermost limit of the BB indicator. Similarly, the SROC indicator line maintains an upward trajectory after breaching the equilibrium level.
With strong bullish signals across multiple timeframes, the SOL/USDT pair shows a high probability of advancing toward the $170 price mark in the near term.