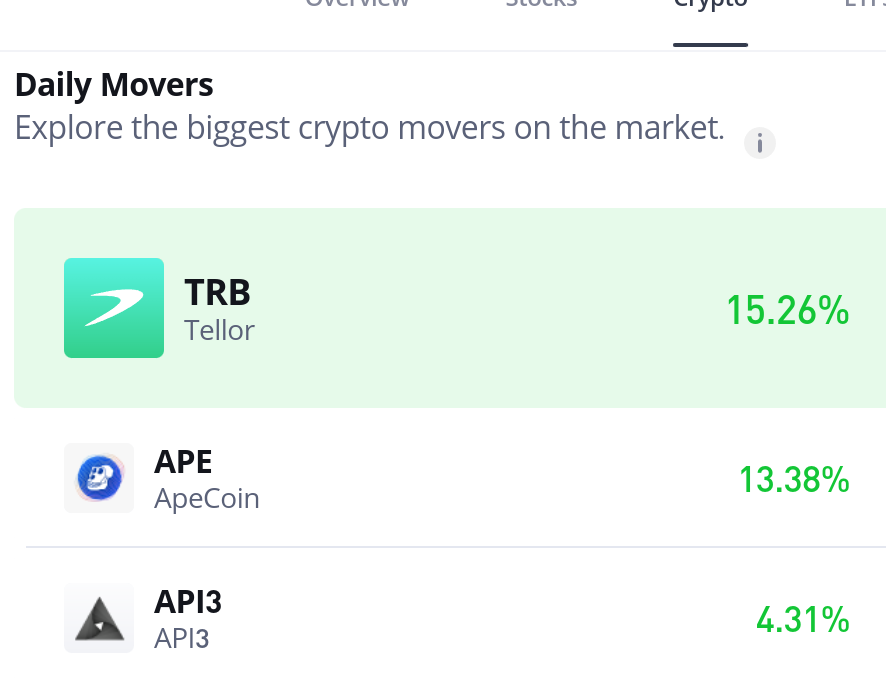
ApeCoin (APE/USD) Breaks Out of $0.685 Consolidation, Accelerates Toward $0.80
Estimated Reading Time: 4 minutes
Don’t invest unless you’re prepared to lose all the money you invest. This is a high-risk investment and you are unlikely to be protected if something goes wrong. Take 2 minutes to learn more
ApeCoin (APE/USD) has maintained a bullish trajectory since bottoming out around the $0.36 level in April, marking the end of a prolonged downtrend that began in late 2024. This key reversal point initiated a gradual yet consistent upward trend, characterized by steady accumulation and moderate gains.
After reaching the $0.60 level, the market entered a consolidation phase that extended from mid-May until now. However, in a decisive move, APE has broken out of the $0.685 resistance zone, confirming renewed bullish momentum. The price is now advancing toward the $0.80 level, signaling growing investor confidence and the potential for further upside in the near term.
Apecoin Market Data
- APE/USD Price Now: $0.775
- APE/USD Market Cap: $579.9 million USD
- APE/USD Circulating Supply: 753 million APE
- APE/USD Total Supply: 1 billion APE
- APE/USD CoinMarketCap Ranking: #108
Key Levels
- Resistance: $0.80, $0.85, and $0.90
- Support: $0.70, $0.65 and $0.60
ApeCoin (APE/USD) Technical Outlook: Cautious Optimism Builds as Price Approaches Key Resistance
An analysis of ApeCoin (APE/USD) on the daily chart reveals a tone of cautious optimism among traders. This sentiment is reflected in the recent surge in demand, even as the price advances toward a key resistance level near $0.80. Notably, some traders appear to be taking profits at this juncture, indicating hesitation as the market tests this critical zone.
Despite the recent recovery, ApeCoin remains in a broader bearish structure when assessed using longer-term moving averages. The asset has been in a sustained downtrend since late 2024, and higher timeframe indicators—beyond the 20-day moving average—still place the market in bearish territory. However, the 20-day moving average now supports a short-term bullish outlook.
The recovery that began in April has been gradual yet promising. A confirmed breakout above the $0.80 level would strengthen this trend and signal a more formidable shift in momentum. Moreover, such a move could attract renewed investor interest and potentially drive APE out of its long-standing bearish phase.
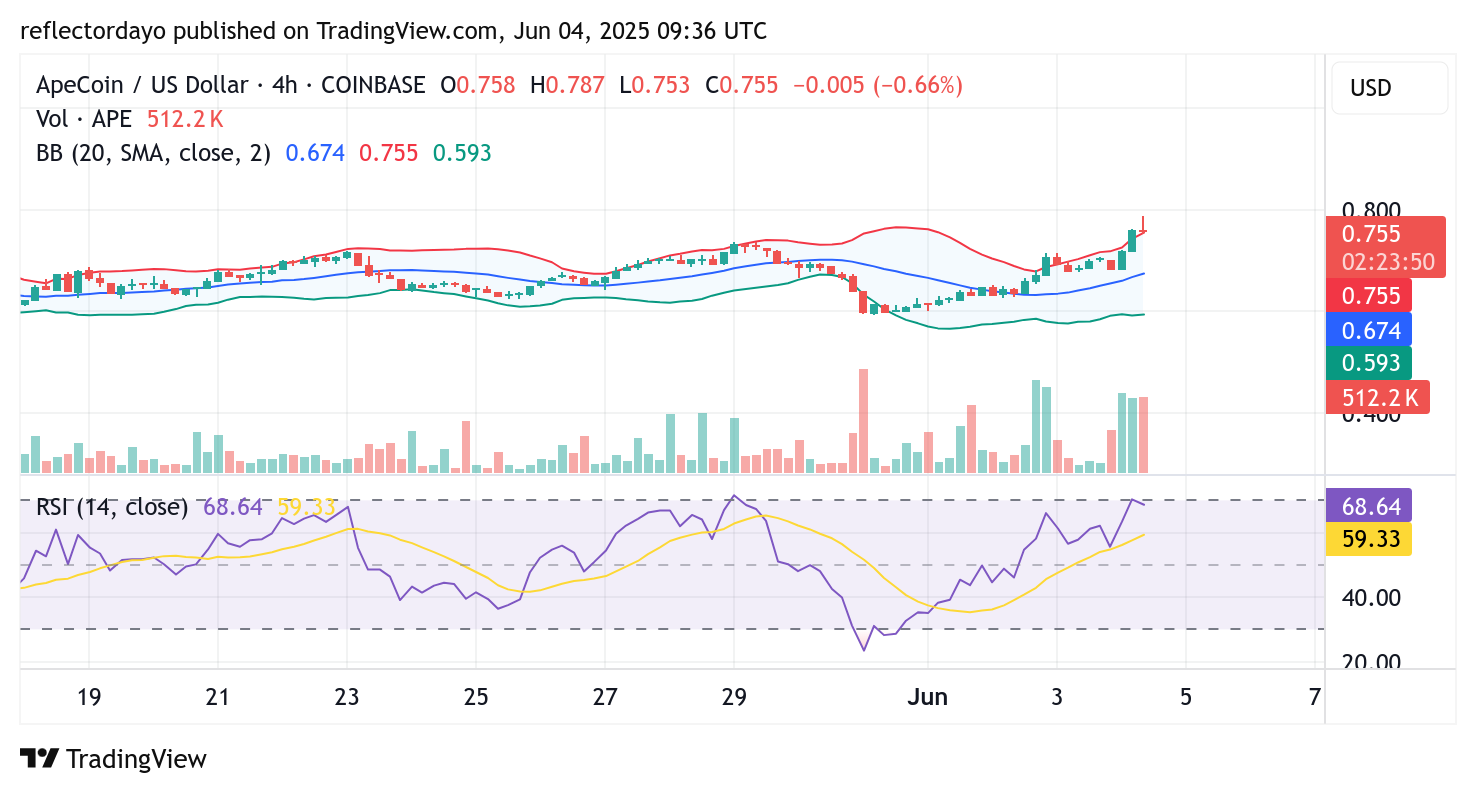
APE/USD 4-Hour Chart Analysis: Breakout Sparks Volatility as Bulls Target $0.80 Confirmation
ApeCoin (APE/USD) recently broke out of a descending channel on the 4-hour chart—a technical development that often signals a potential shift in market sentiment. Following the breakout, the price has entered a consolidation phase between $0.70 and $0.87. If bullish momentum persists, a retest of the 200-day Exponential Moving Average (EMA) around $1.06 could come into play.
The $0.80 level remains a pivotal resistance zone. A confirmed breakout above this mark would validate the ongoing recovery and offer relief to many long-term holders who have endured sustained losses during the prolonged downtrend that began in late 2023. A sustained close above $0.80 would not only restore confidence but also attract fresh bullish interest.
However, the current breakout has introduced heightened market volatility, increasing the likelihood of a corrective pullback. Still, even in the event of a retracement, the emergence of a higher support level would be a constructive signal—potentially giving bulls the footing they need to push the price action further to the upside.