Solana (SOL) Price Prediction: SOL/USDT Continues South Below $120
Estimated Reading Time: 2 minutes
Don’t invest unless you’re prepared to lose all the money you invest. This is a high-risk investment and you are unlikely to be protected if something goes wrong. Take 2 minutes to learn more

Date: January 30, 2026
The Solana market has fallen below the long-term support at the $120 price level. The market has continued to decline, with price action moving to lower levels as it approaches the $110 mark.
Long-Term Trend: Bearish (Daily Chart)
Key Price Levels
Resistance: $115, $120, $125
Support: $110, $105, $100
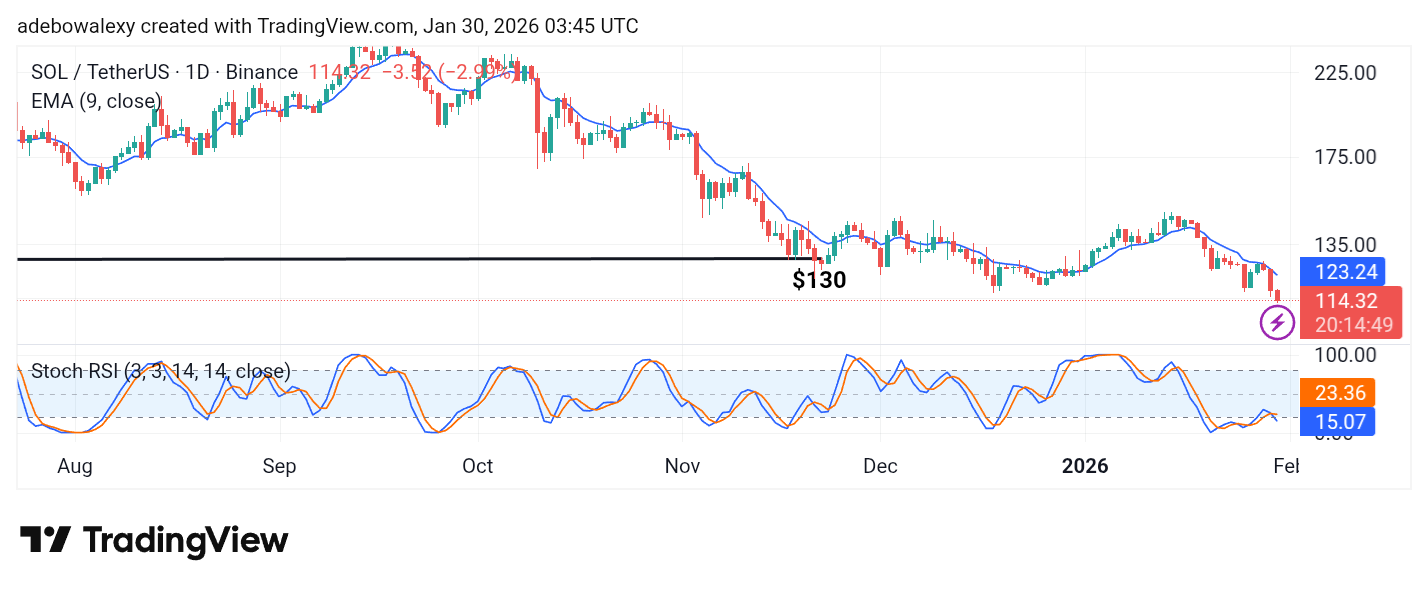
The Solana market has eventually broken the long-term psychological support at the $120 level. The most recent price candle is bearish and continues downward below the 9-day Exponential Moving Average (EMA). The Stochastic Relative Strength Index (SRSI) lines have completed a bearish crossover and remain pointed lower within the oversold region.
Solana (SOL) Price Prediction: Solana Continues to Descend
Over the past two sessions on the Solana daily chart, bearish pressure has remained dominant. The latest price candle is bearish and continues to trade below the 9-day EMA.
The SRSI indicator suggests renewed bearish momentum, as its lines have just formed a downward crossover in the oversold region. Consequently, selling pressure may intensify and trigger further price declines in subsequent sessions.
Solana (SOL) Price Prediction: SOL/USDT Bears Maintain a Firm Grip (4-Hour Chart)
On shorter time frames, bearish forces also remain in control. The current session’s price candle is sizeable and bearish, trading below the 9-day EMA while testing the $110 support level.
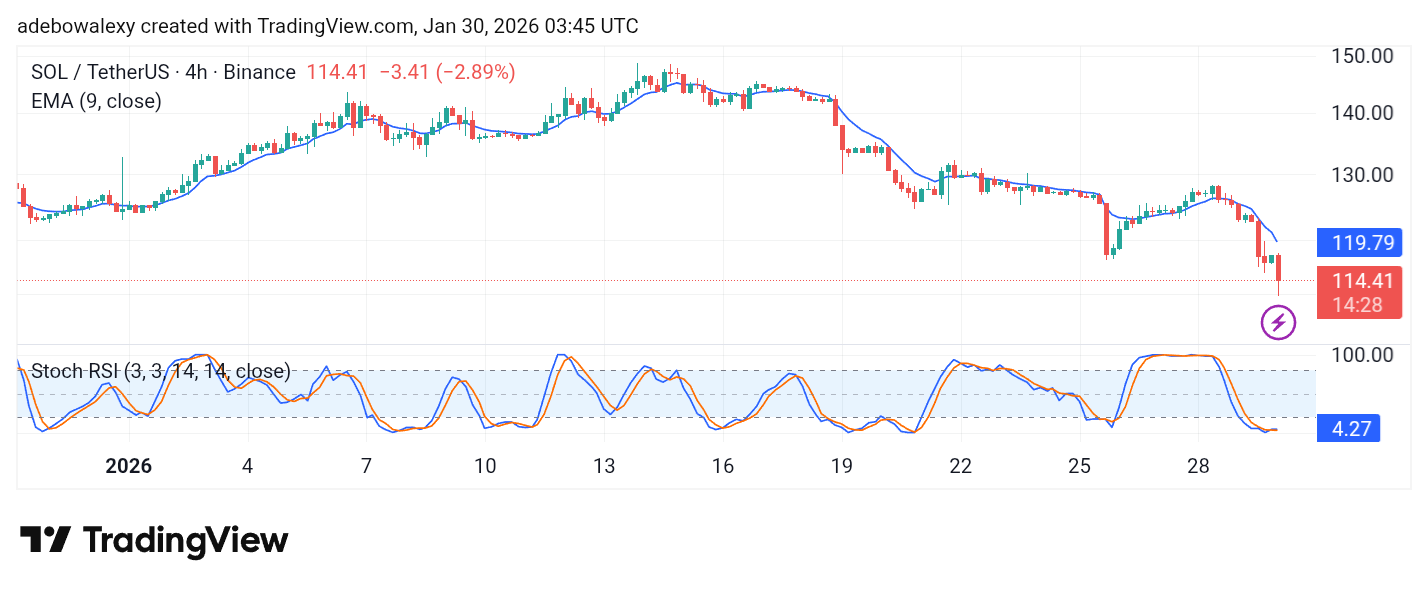
The SRSI lines are also positioned in the oversold region, with their latest movement offering little indication of an imminent reversal. As a result, bears may soon breach the $110 support level.