BNB (BNB/USDT) Consolidates Near $693.44
Estimated Reading Time: 3 minutes
Don’t invest unless you’re prepared to lose all the money you invest. This is a high-risk investment and you are unlikely to be protected if something goes wrong. Take 2 minutes to learn more
BNB Long-term Analysis: Bullish
BNB against the Tether has grown significantly in the weekly timescale, with higher highs and slight dips in previous sessions. However, the current price movement by major indicators suggests that the pair has trouble rising to the north around $693.44.
The indicators on the chart suggest bearish traders may flood the market in the near term. Therefore, caution is advised as the price may move in either direction.
Currently, BNB is trading at $691.30 after a minor 0.29% weekly price dip.
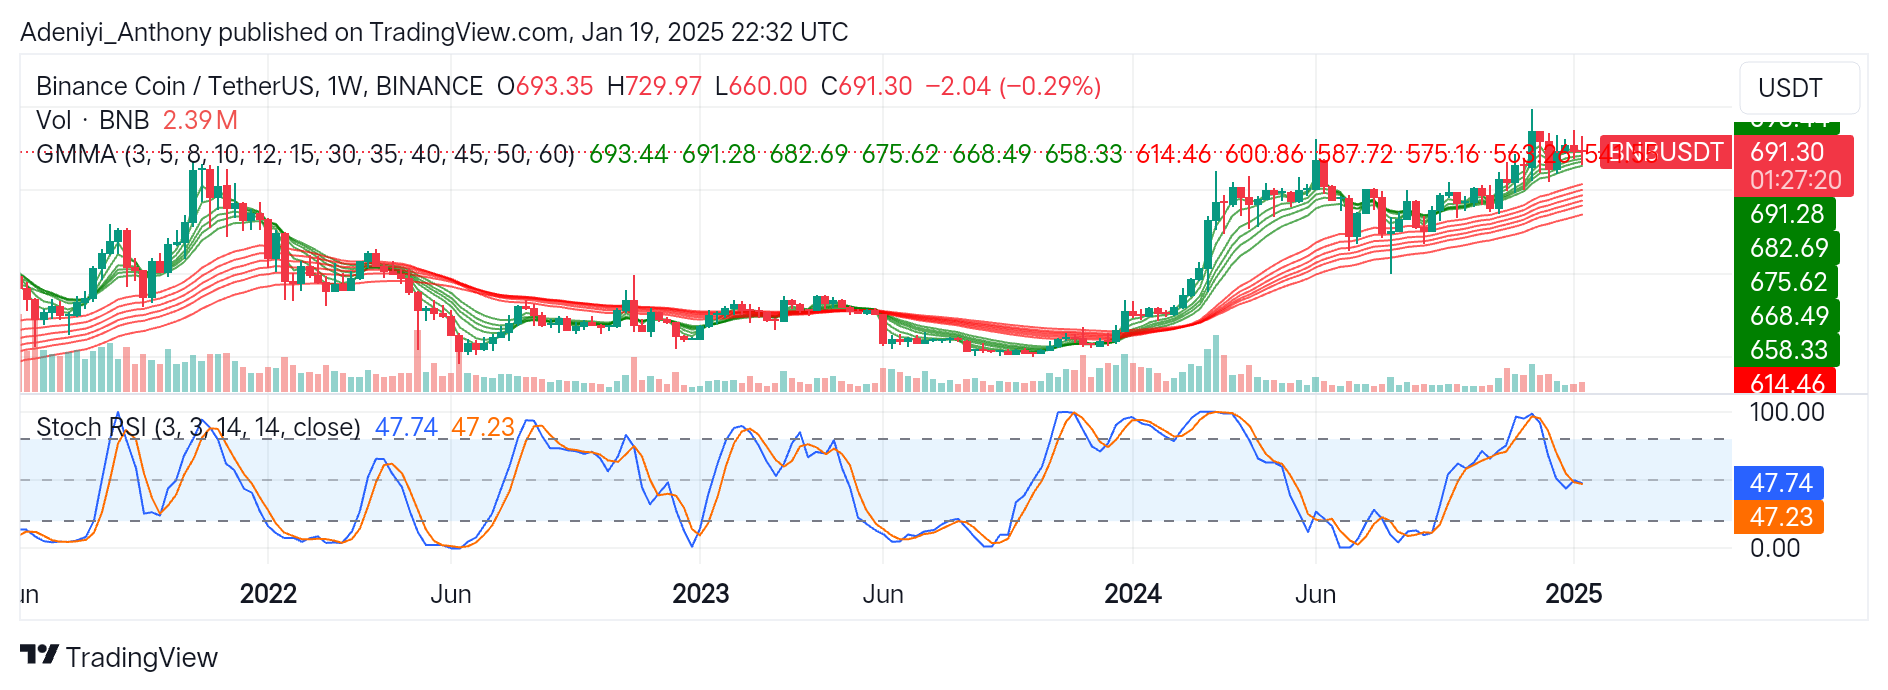
Technical Indicators
Major Resistance Levels: $693.44, $729.00, and $750.00
Major Support Levels: $682.69, $660.00, and $614.00
BNB Technical Analysis
The analysis of BNB against the Tether reflects a bullish structure with the price holding above the Guppy Multiple Moving Averages (GMMAs), indicating long-term upward strength.
However, the positioning of the lines of the Stochastic RSI suggests a neutral condition as both lines read within the 40-mark level.
From another angle, the declining trading volume shows reduced trading activity, confirming an impending stagnation as prices retrace from $693.44.
To this end, if the price sustains above $690, a breakout above the immediate resistance may be possible; otherwise, a break to the south may be inevitable.
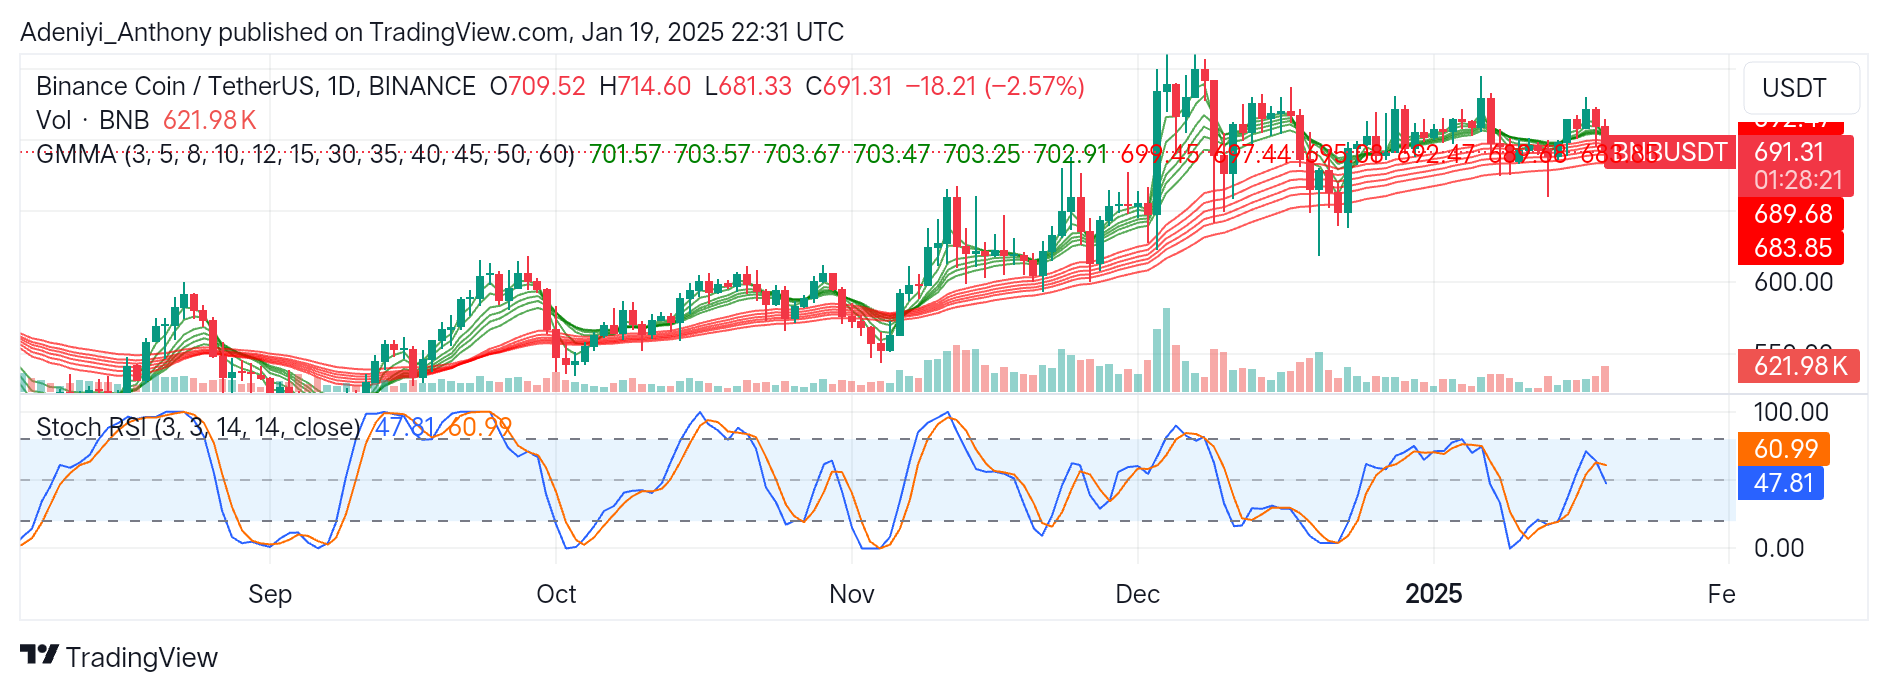
BNB/USDT Analysis: Where From Here?
On the daily timeframe, BNB/USDT is trending downward after experiencing a 2.57% dip in price for the day. The GMMAs, on the one hand, suggest a less volatile market as both sets of EMAs converge, further signaling the pair is acting under selling pressure.
On the other hand, the Stochastic oscillator points downward in a neutral position, indicating that in the short term, the price may dip towards $692.47.
However, with the current participation and outlook, the BNB/USDT market signals indecision among buyers and sellers.
To this end, a break above $693.00 would signal the resurgence of bullish traders in the market. Conversely, a bearish spike in volume would suggest a move to the south.
You can purchase crypto coins here. Buy LBlock