Ethereum Price Slips Below $3,000 as Long-Term Trend Pressure Persists
Estimated Reading Time: 3 minutes
Don’t invest unless you’re prepared to lose all the money you invest. This is a high-risk investment and you are unlikely to be protected if something goes wrong. Take 2 minutes to learn more
The Ethereum price in the last 24 hours appears to have edged up marginally by 0.67%. This small appears to be materializing after a sharp 9.38% weekly decline. This move suggests a short-term bounce rather than a clear trend reversal, as the selling pressure remains.
As it stands, easing macro fears and oversold technical signals appears to be playing the positive role, encouraging dip buying. However, the Ethereum ETF still faces continued outflows as potential upside movement is limited by cautious institutional investors.
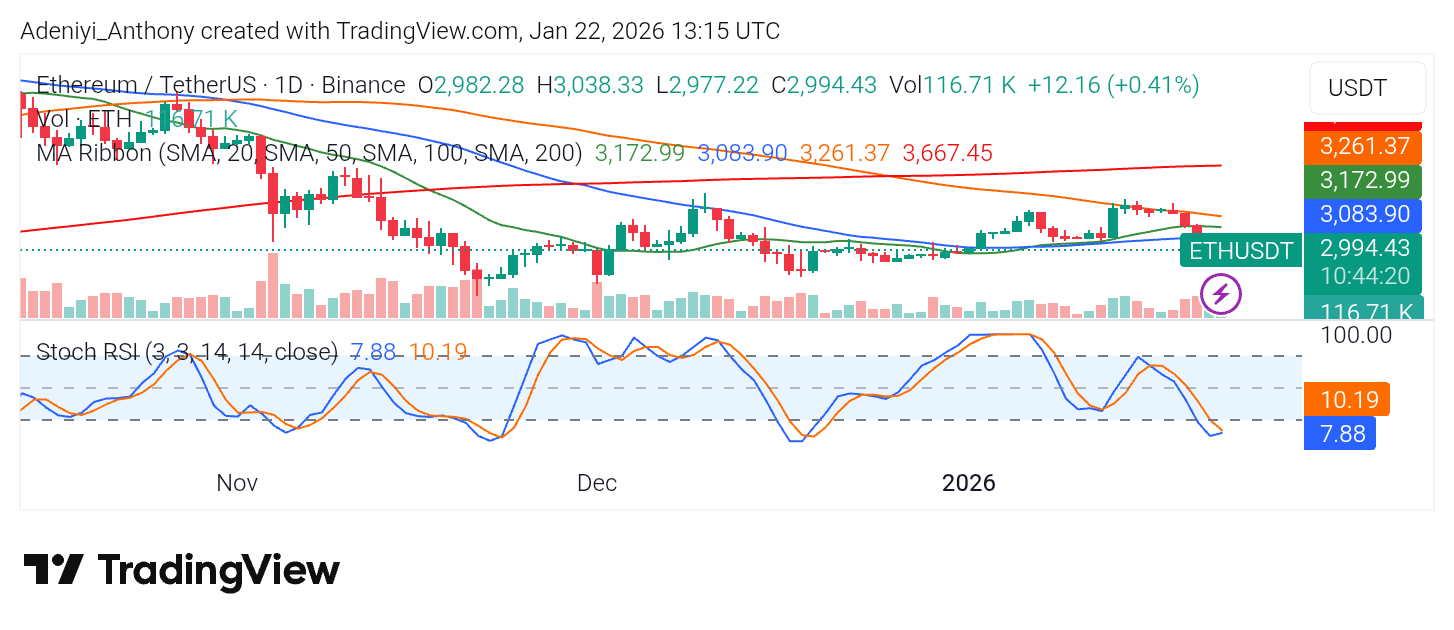
Currently, Ethereum trades at $2,994.43 with over 116k volumes on the daily chart.
Technical Indicators
Major Resistance Levels: $3,050, $3,180, and $3,300
Major Support Levels: $2,980, $2,850, and $2,700
Technical Analysis
On a daily basis, Ethereum’s price remains structurally weak, although stabilizing below the $3,000 mark, which is below the pack of simple moving averages. This shows that the overall trend is still gloomy.
From a different perspective, the recent attempts at recovery appears weak due to dropping volume. Meanwhile, a slight rebound is more likely because the Stochastic RSI is heavily oversold. However, a trend reversal cannot be confirmed by oversold conditions alone.
To this end, for the Ethereum must reclaim and hold above the $3,180 zone with expanding volume for a trend reversal; otherwise, the price is vulnerable to another supports.
Ethereum Wave News
Ethereum on the daily timeframe presents a dominant bearish thesis with the attention on a developing C-wave to the downside towards $2,626 and $2,258. While a bullish alternative is feasible owing to recent reactions around the $2,895 Fibonacci level, the current momentum implies that more decline is required to complete the five-wave series.
As it stands, the short-term price action shows a delicate balancing act between support and resistance. Sellers currently maintain control below the $3,115 to $3,131 zone, which must be reclaimed to invalidate the immediate bearish microstructure. On the other hand, a breakout above resistance would direct attention toward a more intricate corrective bounce, while a decisive fall below recent local lows would indicate the next leg of the drop.
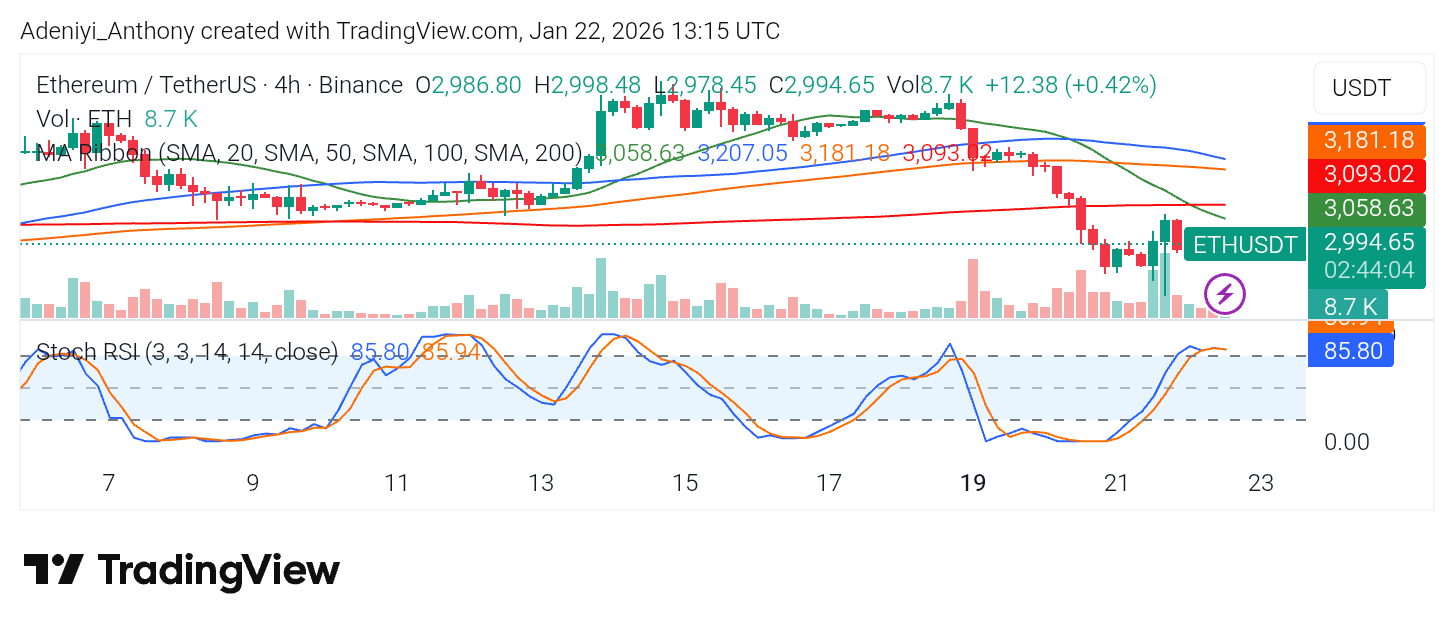
ETH/USDT Analysis: Ethereum Price Sees Short-Term Rebound as Oversold Conditions Trigger Bounce
The 4-hour chart of ETH/USDT appears to support the daily view by displaying a short-term recovery attempt from the steep sell-off near $2,900. The Ethereum price has rallied near the 20-period SMA, while the Stochastic RSI has risen into overbought territory, indicating strong short buying opportunity.
To this end, a sustained consolidation above $3,000 could allow for another push higher, but without a clean reclaim of the $3,180–$3,220 region, upside may not be recorded.
You can purchase crypto coins here. Buy Crypto