The Universal Market Access (UMA/USD) Initiates Recovery, and the Early-Year Volatility
Estimated Reading Time: 3 minutes
Don’t invest unless you’re prepared to lose all the money you invest. This is a high-risk investment and you are unlikely to be protected if something goes wrong. Take 2 minutes to learn more
In the initial months of this year, Universal Market Access experienced a dynamic market environment marked by heightened volatility. Price fluctuations occurred within a broad price channel, driven by prevailing bullish sentiment. The momentum from bullish traders propelled the market to achieve a yearly high of $3.249. Subsequently, bearish traders seized the opportunity presented by this peak and the increased volatility to instigate a substantial bearish downturn, causing the price to retreat to the support level observed at the beginning of January.
While expectations suggested a potential rebound from this support level, the market, instead, entered a phase of sideways consolidation for an extended period.
The Universal Market Access Data
- UMA/USD Price Now: $0.5913
- UMA/USD Market Cap: $135,446,785
- UMA/USD Circulating Supply: 74,975,657 UMA
- UMA/USD Total Supply: 115,869,045 UMA
- UMA/USD CoinMarketCap Ranking: #200
Key Levels
- Resistance: $2.00, $2.50, and $3.00.
- Support: $1.00, $0.90, and $0.80.
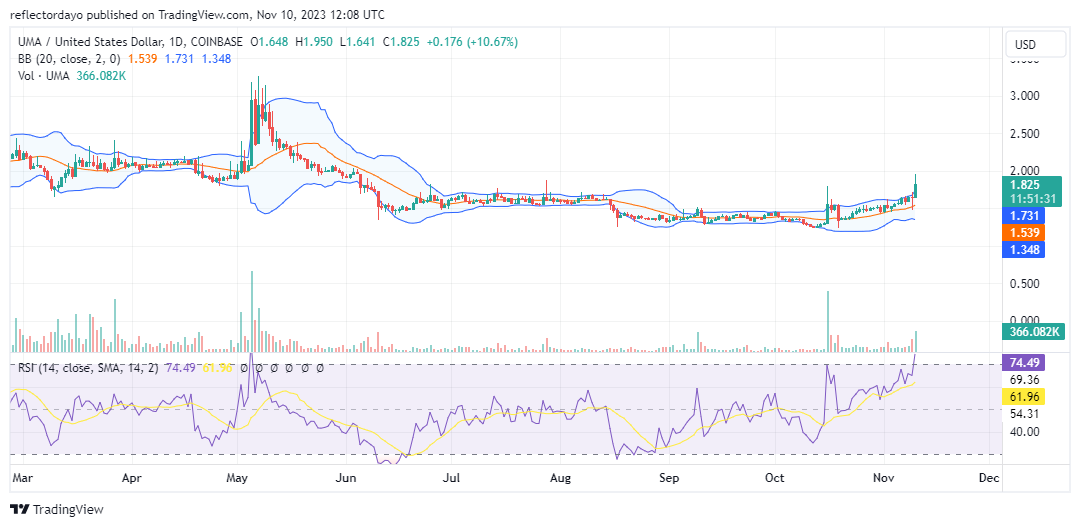
The Universal Market Access Price Forecast: Analyzing the Indicators
The Universal Market Access commenced its bullish trend for the year from the $1.50 price level. As bearish pressure retraced the market to this initial point, traders congregated with optimism, anticipating a renewed rally. Despite their hopes, persistent selling pressure endured for approximately two months, resulting in a consolidation phase.
During this period, the relentless selling pressure compelled a shift in support to $1.28, where consolidation persisted for an additional two months. In the latter half of October, a surge in trading volume catalyzed a notable upward movement in prices. This positive development is reflected in the Relative Strength Index (RSI), which exhibits rapid oscillations with a trend of higher lows, signifying an increasing momentum.
Nevertheless, caution is warranted as the market may encounter formidable bearish resistance, particularly around the $2.00 price level.
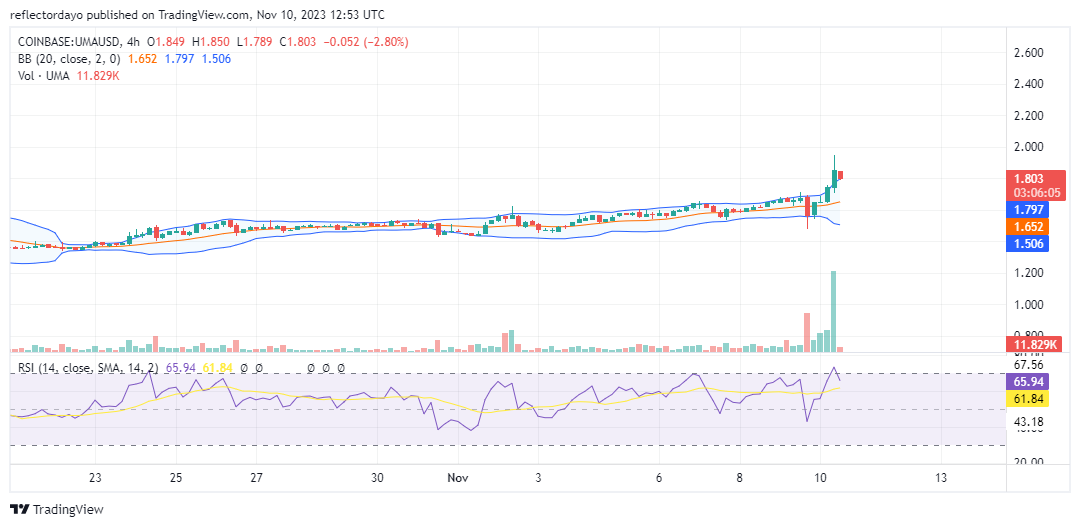
UMA/USD 4-Hour Chart Outlook
As the market approaches the $2.00 price level, traders have initiated profit-taking, leading to a retracement in price. Additionally, a thorough analysis of the Relative Strength Index (RSI) on the 4-hour chart indicates that the recent price recovery coincides with the market entering overbought territory as it approaches a critical resistance level. This overbought condition has contributed to a bearish sentiment, prompting the price to retract.
It is noteworthy that the $1.80 price level is anticipated to serve as a potential support level, playing a crucial role in sustaining the market’s momentum.